
Brent Crude Live Chart in 2026: Your Essential Guide to Navigating a Turbulent Market
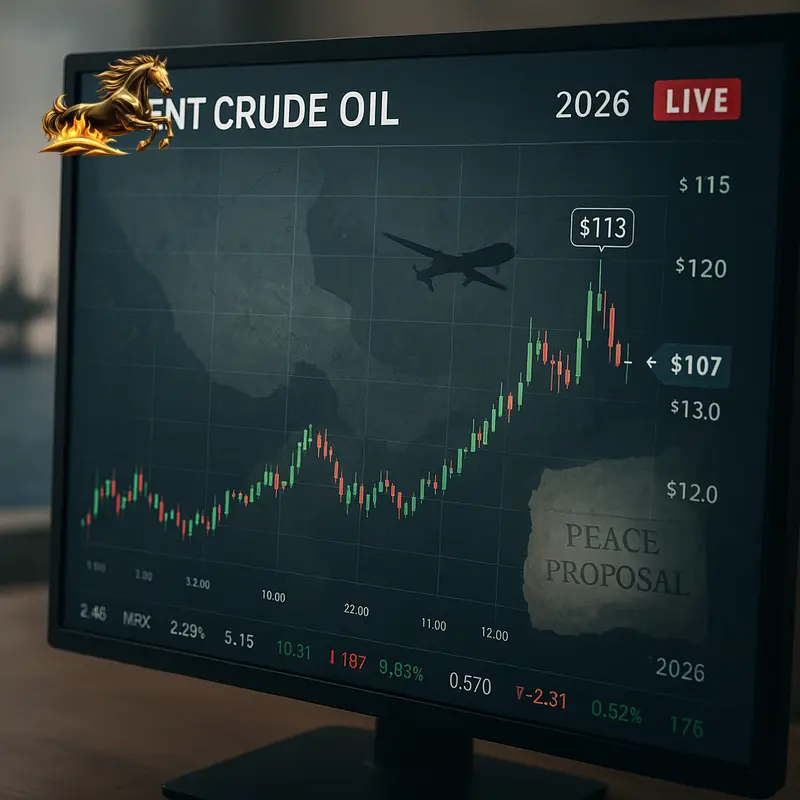
Imagine getting crucial, world-shaping news moments before it hits any major outlet. For energy traders and market analysts in May 2026, that’s not a fantasy—it’s everyday reality. The secret? Closely watching the Brent crude live chart. Lately, this chart has narrated a gripping tale of rising geopolitical tensions, military clashes, and growing market unease. When President Trump dismissed Iran’s peace proposal as a “piece of garbage,” effectively putting a ceasefire on “life support,” Brent crude prices instantly surged above $107 a barrel. More than ever, understanding this live pulse of the global economy is vital—not just for traders but anyone invested in finance, business, or global affairs.
In 2026, Brent crude oil remains the benchmark for about two-thirds of the world’s seaborne crude oil trade. Its live price chart acts as the energy market’s nerve center, transforming complex geopolitical shifts—from the Strait of Hormuz to Washington and Riyadh, down to Kharg Island storage levels—into actionable insights in real time. This guide will help you master reading the Brent crude live chart, understand its movements amid today’s forces, and apply that knowledge to make smarter strategic decisions.
What Is Brent Crude Oil? The Benchmark Explained
Brent Crude is a specific grade of light, sweet crude oil extracted from the North Sea, between the Shetland Islands and Norway. “Light” means it’s relatively low in density, while “sweet” signals low sulfur content—qualities that make it easier and cheaper to refine into high-demand fuels like gasoline, diesel, and jet fuel.
But Brent’s significance goes beyond quality. It’s the primary global price benchmark for crude oil. When news outlets mention “oil prices,” they usually mean Brent crude futures. It sets prices not just for North Sea oil but also for supplies from Africa, the Middle East, and parts of Europe. While benchmarks like West Texas Intermediate (WTI) have grown, Brent’s seaborne nature keeps it dominant, capturing the global market’s pulse more comprehensively.
Why Brent Still Matters in 2026: Beyond the Barrel
- Global Economic Barometer: Brent prices offer early signals about the world economy’s health. Rising prices often mean strong demand and growth but can also warn of inflation from limited supply. Sharp drops frequently hint at looming recessions.
- Geopolitical Stress Gauge: Brent quickly reacts to geopolitical risks, especially in oil-producing regions. As May 2026 shows, tensions in the Middle East trigger instant price spikes reflecting supply disruption fears.
- Policy and Energy Transition Barometer: Brent influences decisions on energy policy and investments. High prices accelerate renewables and electric vehicle adoption; lower prices tend to support fossil fuel reliance. During today’s energy transition, Brent’s signals shape the global energy landscape like never before.
The Indispensable Power of a Brent Crude Live Chart
A static price is just a snapshot. A live chart tells a real-time story unfolding second by second—which is crucial in today’s fast-moving markets.
Live charts plot price versus time continuously, offering these benefits:
- Instant Risk and Opportunity Detection: In a world where fortunes hinge on breaking news, speed matters. Live charts let traders react immediately to price changes—capturing gains or limiting losses.
- Spotting Trends and Patterns: They turn thousands of data points into intuitive visuals, revealing trends, support and resistance zones, and momentum signals vital for forecasting.
- Contextual Decision Support: Most platforms integrate live charts with real-time news feeds and economic calendars, linking specific events—drone strikes, policy shifts—to market moves.
- Strategic Planning: Companies dependent on fuel costs or governments forecasting revenues use these charts alongside futures curves to manage risks and plan ahead.
Knowing how to read a Brent crude live chart isn’t optional anymore—it’s a strategic must.
Decoding Volatility: Key Drivers of Brent Prices in 2026
What moves the line on the Brent crude live chart? In 2026, a complex mix of factors shapes prices:
1. Geopolitical Events: The Main Driver
Geopolitics dominate Brent’s swings, especially amid U.S.-Iran tensions:
- Strait of Hormuz: About 20% of global oil passes here. Any threat sparks panic.
• May 2026 saw the U.S. Navy start a convoy system escorting tankers, reviving bold “Project Freedom.”
• Iran’s retaliatory threats heightened supply disruption fears.
• Brent prices jumped 4%, reflecting this risk premium. - Infrastructure Attacks: On May 4, Iranian drone strikes damaged the Fujairah oil storage terminal in the UAE—a key alternative route bypassing Hormuz.
• Brent soared above $113 per barrel. - Diplomatic Fallout: When President Trump called Iran’s peace proposal a “piece of garbage,” hopes of ceasefire collapsed.
• Brent blew past $107, pricing in a prolonged crisis.
2. Supply Fundamentals: Production Meets Inventory
Supplies underpin price volatility:
- Iranian Storage Crisis: U.S.-led naval blockade caused Kharg Island’s storage to hit 74% capacity by May 2026.
• If the blockade persists, Iran must cut production—removing significant barrels from markets. - OPEC+ Decisions: Their production quotas still sway supply in this uncertain demand environment.
- Non-OPEC Producers: U.S. shale’s flexibility is limited by capital discipline, making quick supply boosts harder than before.
3. Global Demand
Major economies set the demand tone:
- U.S., China, and Europe growth trajectories dominate.
- Slow EV and renewable adoption gradually reduce oil demand growth.
4. U.S. Dollar and Financial Markets
Being USD-denominated, oil prices move inversely to the dollar’s strength. A stronger dollar makes Brent costlier for other currency holders, limiting demand. Central bank policies, financial markets, and commodity fund flows also impact price dynamics.
Case Study: May 2026—A Month of Brent Crude Upheaval
Recent moves reveal how geopolitics and fundamentals interplay:
- Early May: Prices stayed elevated but range-bound, as the market waited.
- May 4—Fujairah Strike: Price spiked to $113, factoring loss of a vital export route.
- May 5—Project Freedom Volatility: U.S. tanker escorts through Hormuz sparked conflict fears, triggering volatile intraday swings.
- Mid-May Diplomatic Breakdown: Trump’s peace rejection swept away easing hopes, pushing Brent higher, setting a new floor above $107.
- Storage Pressure: Iran’s storage limits threatened forced production cuts, providing a solid supply floor.
This shows why tracking live charts is crucial to grasp rapid market shifts driven by news and fundamentals.
How to Access and Analyze a Brent Crude Live Chart
Thanks to technology, professional live charts are now available to everyone. Here’s how to get started:
Top Platforms in 2026
- Investing.com & TradingView: Real-time data, customizable charts, technical indicators, and active communities.
- Broker Platforms (OANDA, IG, Saxo Bank): Combine live charts with trading tools.
- Trading Economics: Blends price charts with macroeconomic data.
- Professional Terminals (Reuters Eikon, Bloomberg): Deep data, news, and analysis tools unmatched by others.
Features to Use
- Timeframes: Tick, minute, daily, weekly, or monthly—choose based on your trading style.
- Indicators: Moving averages (50- and 200-day), RSI, Bollinger Bands for trends and volatility.
- Drawing Tools: Mark support/resistance, connect trendlines.
- Volume Data: Confirm move strength or breakouts.
- Integrated News: Link price moves with geopolitical or economic events in real time.
Strategic Uses: From Insight to Action
Traders and Investors
- Intraday Trading: Capture volatility during news.
- Swing Trading: Follow medium-term trends and trade corrections.
- Risk Management: Use stop-losses tied to technical levels.
Businesses and Risk Managers
- Fuel Hedging: Airlines locking costs when Brent surges past $110.
- Budgeting: Manufacturers gauge future energy costs from futures curves.
- Supply Chain Prep: Proactively manage disruptions.
Policymakers and Analysts
- Inflation Tracking: Brent prices feed inflation outlooks.
- Geopolitical Risk Mapping: Price moves measure tension impacts.
- Energy Security: Strategize reserve releases based on benchmark differences.
The Future of Brent Crude and Live Market Analysis
Looking ahead:
- More Volatility: Energy transition and geopolitics will keep prices swinging.
- Smarter Data: Platforms will integrate satellite, grid data, and sentiment analytics.
- Continued Central Role: Despite renewables’ rise, Brent remains central to the global economy.
Conclusion: Master the Global Economy’s Pulse
The Brent crude live chart is more than a price ticker—it’s a real-time window into the world’s economic and political heartbeat. May 2026’s upheavals—from drone strikes to diplomatic fallout and storage crises—highlight how interconnected forces jolt prices. Learning to read the chart, understanding market drivers, and applying that insight gives you a powerful tool for financial literacy and strategy.
Every price move tells a story. Your job is to listen and interpret smartly. Start by watching a live Brent crude chart alongside breaking news, ask: Is this move driven by geopolitics, supply shifts, or market sentiment? Over time, the flickering line reveals a clear narrative of global opportunity and risk.
How to Get Started
- Bookmark a Chart: Create a free account on TradingView or visit Investing.com and load the Brent crude (UKOIL) live chart.
- Set Alerts: Configure price alerts at key levels to catch rapid changes.
- Follow the News: Track Middle East updates, OPEC decisions, and economic releases alongside the chart for a week.
- Identify Trends: Add a 50-day moving average to spot price direction.
In 2026’s volatile energy market, real-time knowledge isn’t just power—it’s profit, risk reduction, and foresight.
Frequently Asked Questions (FAQ)
Q1: What’s the difference between Brent Crude and WTI?
Brent Crude is a seaborne North Sea benchmark setting prices for Europe, Africa, and the Middle East. WTI (West Texas Intermediate) is a landlocked U.S. benchmark priced at Cushing, Oklahoma. Brent is slightly heavier and less sweet. Their price spread depends on export capacity, regional supply-demand, and Atlantic basin geopolitics.
Q2: Why did Brent spike sharply in early May 2026?
Two major geopolitical shocks: Iranian drone strikes on UAE’s Fujairah terminal and the U.S. naval escort convoys through Hormuz triggered fears of a Strait closure, pushing prices sharply higher.
Q3: How does the Iranian storage crisis at Kharg Island affect global prices?
Storage reached 74% capacity under a U.S.-led blockade. Once full, Iran must cut production, removing barrels from global supply and underpinning prices beyond headline events.
Q4: How can beginners start analyzing a live oil chart?
Use free platforms like TradingView. Watch daily price moves for a week, add a simple 50-day moving average, and read news linked to big price swings. Avoid complex indicators early—focus on understanding market drivers.
Q5: Are live charts reliable for long-term energy investments?
Live charts are essential for timing and managing risk but should be combined with fundamental analysis like supply/demand forecasts, geopolitical outlooks, and energy transition trends for robust long-term decisions.
By mastering the language of Brent crude live price moves, you join a global community turning complex energy market dynamics into clear insight and strategic opportunity.