
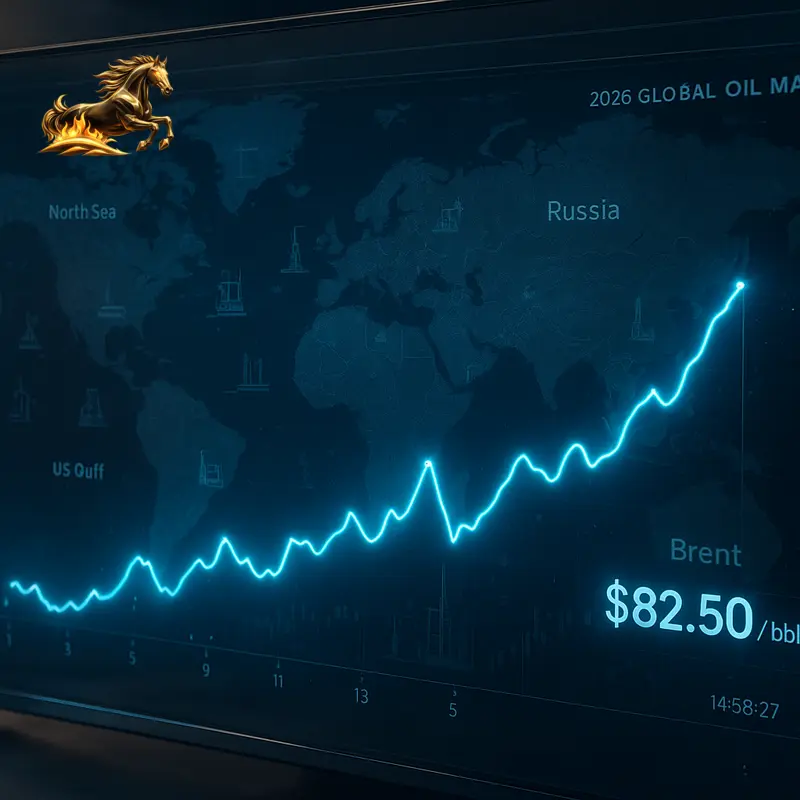
Brent Chart Live: Your Real-Time Guide to Navigating
Brent Chart Live: Your Real-Time Guide to Navigating Oil Markets in 2026
Picture a single chart that pulses at the very core of the global economy—a dynamic line that influences everything from national budgets and corporate strategies to the price you pay at the pump. This isn’t some futuristic notion. It’s the everyday reality of the Brent crude oil market in 2026. Mastering how to read a live Brent chart isn’t just for traders on Wall Street; it’s essential for anyone who wants to grasp the shifting tides of geopolitical stability, economic health, and the ongoing energy transition.
Right now, Brent crude prices sit just above $72 per barrel, marking their lowest level in over four months. A modest daily gain of 0.6%, pushing to $72.47, offers brief relief, but the bigger picture points to only a slow climb, with forecasts nudging prices toward $74.79 by the quarter’s end. This fluctuating line represents more than data—it mirrors rising global supply concerns and a fading geopolitical risk premium.
In this post, we won’t just watch the Brent price move; we’ll unpack the chart’s anatomy, decode its signals, and highlight its strategic value. Whether you’re a finance pro, a business leader managing fuel costs, or a global affairs enthusiast, understanding the live Brent chart is your key to navigating today’s complex world.
Why Brent Crude Is the Undisputed Global Oil Benchmark
Before diving into the chart, let’s clarify what Brent crude oil really is. Sourced from North Sea fields, Brent is prized for its “light” and “sweet” qualities, making it ideal for refining into gasoline and diesel. As the globe’s primary pricing benchmark, Brent sets the tone for nearly two-thirds of internationally traded crude.
This benchmark status means Brent prices reflect a global conversation. Headlines about oil price changes almost always reference Brent. Its futures and options trade continuously on major platforms like London’s Intercontinental Exchange (ICE), generating the live data powering today’s interactive charts.
Brent has evolved from a regional grade into the industry’s universal language—a single number summarizing complex global supply disruptions, demand forecasts, and geopolitical moves.
Dissecting the Live Brent Chart: Your Digital Oil Market Dashboard
A live Brent chart is far more than just a graph. It’s a sophisticated dashboard delivering real-time insights. Leading platforms like TradingView, Investing.com, and IG transform raw price data into powerful analytical tools. Here’s what to expect:
Price Action Window
- Candlesticks or Lines: Show open, high, low, and close prices, painting a vivid picture of market trends and sentiment.
- Time Scale: Adjustable views let you analyze short-term intraday action or zoom out for long-term trends.
- Current Quote: Live price and daily change figures provide instant market context.
Analytical Toolkit
- Moving Averages (MA): Smooth out price data to reveal bullish or bearish momentum.
- Relative Strength Index (RSI): Highlights if Brent is overbought or oversold.
- Volume Bars: Confirm the strength behind price moves.
- Support and Resistance Lines: Mark key levels where prices often reverse, guiding entry and exit points.
Integrated Context Panels
- Real-Time News Feeds: From Reuters and CNBC, linking headlines—like Gulf hurricanes or OPEC meetings—to market moves.
- Economic Calendars: Upcoming events such as U.S. EIA inventory reports or Chinese PMI data signal volatility.
- Related Markets: Snapshots of WTI crude, natural gas, gasoline futures, and the U.S. Dollar Index give you a comprehensive market perspective.
Customization and User Experience
Modern platforms let you personalize your experience—save chart settings, set alerts at critical price levels, and easily share analysis—turning public data into your own strategic advantage.
The Power of Live Data: How Real-Time Charts Revolutionize Oil Market Interaction
- Equalizing Information: Traders worldwide see price shifts and news simultaneously, boosting market fairness and efficiency.
- Speeding Decisions: Rapid price moves enable real-time hedging and speculation.
- Sharpening Strategy: Risk managers tweak tactics dynamically, protecting assets or seizing opportunities.
- Opening Access: Individuals and small businesses now access the same live charts as major institutions, broadening market engagement.
What 2026’s Brent Chart Reveals Today
Brent’s linger near $72, its four-month low, reflects key forces at play:
Rising Global Supply: Increased output from U.S. shale, Guyana, and Brazil floods the market, while OPEC+ production discipline faces pressure. Repeated U.S. EIA reports of crude stock builds underline this supply glut.
Eroded Geopolitical Risk Premium: Earlier Middle East tensions lifted prices. Now normalized shipping through the Strait of Hormuz has removed that premium, damping bullish enthusiasm.
Technical Breakdown: Key support near $78-$80 has broken, revealing a bearish trend. Prices fluctuate between $71-$73, with rallies met by selling pressure—a classic sign of a downtrend.
Together, fundamental and technical signals indicate supply currently surpassing demand.
The Fundamentals Behind Brent Price Movements
To truly grasp Brent’s trajectory, keep in mind the core drivers:
Supply Factors
- OPEC+ Production Choices: Saudi Arabia and Russia’s quota decisions can instantly sway prices.
- U.S. Shale Flexibility: Shale’s quick production adjustments act as a global swing supplier.
- Geopolitical Events: Conflicts or sanctions that bottleneck supply cause price spikes.
Demand Influences
- Economic Growth: Healthy GDP and manufacturing boost demand; recessions weaken it.
- Transportation Shifts: Electric vehicle adoption and travel patterns impact fuel consumption.
- Seasonality: Demand peaks in summer driving and winter heating seasons.
Macro-Financial Context
- Dollar Strength: A strong U.S. dollar raises oil costs in other currencies, hitting demand.
- Interest Rates & Inflation: Higher rates often curb economic growth, pressuring prices down.
- Speculative Moves: Futures market positioning hints at potential trend reversals.
From Insight to Action: Applying the Live Brent Chart Across Industries
No matter your role, the live Brent chart powers smarter decisions:
- Corporate Hedging: Airlines and transport companies can lock in fuel costs when charts signal impending price hikes.
- Trading: Investors employ support and resistance levels along with indicators like RSI to time entries and exits.
- Policy Planning: Governments use real-time market trends to adjust energy revenues and fiscal policies.
- Media & Research: Journalists quickly link price moves to unfolding events, keeping the public informed.
The Road Ahead: AI, Integration, and Smarter Analytics for Brent Charts
Looking forward, Brent charts will be more than reactive tools:
- AI-Powered Forecasts: Predictive analytics blending satellite data, social media, and market info will project price scenarios.
- Cross-Market Views: Integrated visuals will connect oil prices with equities, bonds, carbon markets, and crypto.
- Personalized Alerts: AI will tailor notifications to your unique interests and strategies.
- Immersive Data Exploration: Virtual reality could let analysts navigate complex market data in three dimensions.
Yet, the mission remains steady: delivering clear, fast, and richly contextual market insights.
Key Takeaways and How to Get Started
The live Brent crude chart is your real-time window into the forces shaping the global economy.
Remember:
- Brent Is the Global Benchmark: It sets the price tone for international oil markets.
- Context Matters: Combine price with news, data, and technical signals.
- Fundamentals Drive the Market: Supply, demand, and geopolitics govern trends.
- Technology Enables Smart Moves: Platforms empower timely decisions.
- Charts Will Keep Getting Smarter: AI and integration bring enhanced foresight.
Start mastering the Brent chart by:
- Selecting a Platform: Explore TradingView, Investing.com, or IG to find your ideal tool.
- Daily Practice: Spend 15 minutes tracking price moves alongside current news.
- Learning Indicators: Get comfortable with RSI, moving averages, and key reports like EIA inventories.
- Following Market Stories: Connect global events to chart movements to build intuitive understanding.
Embracing the live Brent chart keeps you attuned to energy market rhythms—arming you to anticipate change and act with certainty.
FAQ
Q1: How do Brent and WTI differ on live charts?
Brent, from the North Sea, is the global benchmark reflecting worldwide trade and geopolitics, usually trading at a premium. WTI, sourced from U.S. fields, primarily serves North American markets. Both move in tandem but differ due to location and quality.
Q2: Why are Brent prices falling despite Middle East tensions?
While early conflicts raised a risk premium, increased supply from non-OPEC countries and weaker demand concerns have taken precedence, pushing prices down.
Q3: Are technical indicators reliable on Brent charts?
They offer probability-based insights from historical data but aren’t guarantees. Their reliability grows when combined with fundamental analysis and multiple confirming signals.
Q4: How can a trucking company use the live Brent chart beyond price watching?
By spotting trend changes or technical breakouts, companies can strategically time fuel purchases or hedges—transforming from passive observers into proactive cost managers.
Q5: What are the most important news events for Brent chart watchers?
Keep an eye on OPEC+ production updates, weekly U.S. EIA inventory reports, and key demand indicators like Chinese import figures and global economic data.
Navigating the oil markets in 2026 requires more than tracking numbers—it demands understanding the live Brent chart’s deeper story. This guide equips you to turn its real-time signals into confident, informed action in a globalized energy landscape.
