
body {
font-family: ‘Helvetica Neue’, Helvetica, Arial, sans-serif;
color: #222;
line-height: 1.6;
padding: 24px 20px;
max-width: 900px;
margin: auto;
background-color: #fafafa;
}
h1 {
font-size: 2.8rem;
font-weight: 700;
color: #0b3d91;
padding-bottom: 10px;
border-bottom: 3px solid #0b3d91;
margin-bottom: 30px;
}
h2 {
font-size: 2rem;
color: #0b3d91;
margin-top: 48px;
margin-bottom: 16px;
border-bottom: 2px solid #d1d9e6;
padding-bottom: 6px;
}
h3 {
font-size: 1.4rem;
margin-top: 24px;
margin-bottom: 12px;
color: #19457b;
}
p {
font-size: 1.05rem;
margin-bottom: 18px;
color: #333;
}
strong {
color: #0046b8;
}
ul {
margin-left: 1.2em;
margin-bottom: 20px;
color: #2a2a2a;
}
ul li {
margin-bottom: 10px;
}
hr {
border: none;
border-top: 1px solid #ddd;
margin: 48px 0;
}
blockquote {
border-left: 4px solid #0b3d91;
padding-left: 14px;
margin: 28px 0;
color: #0b3d91;
font-style: italic;
}
.faq-question {
font-weight: 700;
color: #0b3d91;
}
.faq-answer {
margin-bottom: 20px;
}
a {
color: #0046b8;
text-decoration: none;
}
a:hover {
text-decoration: underline;
}
The Brent Oil Price Index in 2026: Navigating Geopolitical Shocks, Market Signals, and the Energy Transition
You glance at your screen. The number blinks: $94.74 per barrel. Not long ago, it topped $110, and a year before, hovered near $65. This is the reality of the Brent crude oil price index in 2026—a dynamic figure shaped by shifting geopolitics, fragile supply chains, and the accelerating shift toward cleaner energy. For investors, policymakers, and industry leaders alike, Brent isn’t just a price; it’s a real-time reflection of global economic and political currents.
Brent crude remains the pricing benchmark for nearly two-thirds of internationally traded oil, telling a story of risk, resilience, and transformation. From simmering Middle East tensions to tightening U.S. crude inventories, every movement sends ripples across markets worldwide. In this article, we delve into what drives Brent oil prices in 2026, unpack their far-reaching economic impact, and explore what the future may hold. Understanding these forces is crucial for navigating the complex global energy landscape.
What Is the Brent Oil Price Index?
At its core, the Brent Oil Price Index provides a global reference price for light, sweet crude oil produced mainly in the North Sea. Named after the Brent oilfield discovered in the 1970s, it has grown from a regional marker into the most pivotal international crude benchmark.
“Light” means low density; “sweet” means low sulfur content—qualities making Brent ideal for refining into gasoline, diesel, and jet fuel. As a waterborne commodity transported primarily by sea, Brent anchors pricing for oil from the Atlantic Basin, including Europe, Africa, and the Middle East.
Why Brent Remains the Global Pricing Standard
- Global Pricing Benchmark: Over two-thirds of the world’s crude is priced directly or indirectly based on Brent. Countries like Nigeria and Saudi Arabia set selling prices tied to this index.
- Economic & Geopolitical Barometer: Brent prices react swiftly to global supply-demand shifts and geopolitical developments. Price rises often signal tightening supply or rising risks; dips may signal easing tensions or slower economic activity.
- Foundation for Derivatives: Brent underlies a massive market for futures, options, and swaps on exchanges such as the Intercontinental Exchange (ICE), helping producers hedge risk and investors anticipate price changes.
Bottom line: Brent is more than a commodity price—it’s a vital indicator of global economic health and geopolitical risk.
Current Market Snapshot: Conflicting Trends Shape Mid-2026
By mid-2026, Brent oil prices reflect a tug of war between easing concerns and lingering caution.
Price Correction Driven by Diplomatic Hopes
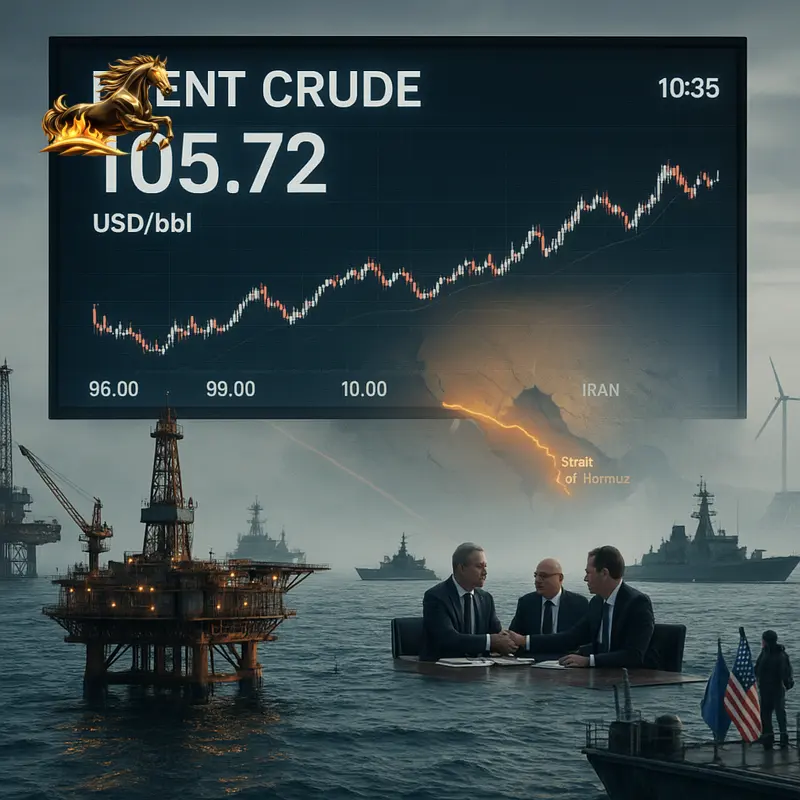
Brent recently dropped about 3% in one session to near $94 per barrel after a three-day rally, marking a 13.8% decline over the last month. This retreat followed tentative diplomatic progress in the Middle East. The U.S. and Iran appear closer to an agreement tied to a tentative ceasefire involving Israel and Hezbollah in Lebanon. Since Iran links any deal to such a ceasefire, traders relaxed the previously high risk premium baked into Brent prices, anticipating fewer supply disruptions. Still, uncertainty lingers with no firm agreement yet.
Strength Holds Despite the Dip
Despite this correction, Brent prices are roughly 45% higher than a year ago, underscoring that the recent drop is a recalibration of extreme short-term fears rather than a collapse.
Drivers supporting price strength include:
- Lingering Geopolitical Flashpoints: Military skirmishes between the U.S. and Iran persist, including naval incidents and commercial shipping attacks, keeping markets alert.
- Strait of Hormuz Importance: This chokepoint channels about one-fifth of global oil and LNG supply, with any threats sustaining a significant price premium.
Insight: Brent hovering near $94-$96 today reflects a cautious market still sensitive to shocks but allowing some breathing room.
Key Drivers of Brent Oil Prices in 2026
Brent prices today emerge from a complex mix of geopolitics, supply-demand fundamentals, financial market dynamics, and the energy transition.
1. Geopolitics: The Leading Short-Term Price Driver
The Middle East remains the epicenter of geopolitical risk:
- Peace or Conflict: True de-escalation could strip out $10-$15 per barrel in risk premiums, pushing prices toward the mid-$80s. Conversely, disruptions in shipping or strikes on infrastructure could send prices soaring above $110.
- Global Shipping Risks: Beyond the Middle East, threats to vessels in the Red Sea and other corridors maintain Brent’s sensitivity to maritime security developments.
2. Supply and Demand Fundamentals: Scarcity Meets Consumption
Physical market fundamentals firmly support Brent prices:
- Near-Minimum U.S. Inventories: Six consecutive weeks of inventory declines leave supply buffers thin, underpinning price stability.
- OPEC+ Discipline: Leading producers Saudi Arabia and Russia manage quotas cautiously to balance revenues and supply.
- Demand Dynamics: Oil demand remains strong across emerging Asian markets but faces headwinds from electrification and efficiency policies. Short-term demand is steady; long-term growth plateaus or falls.
3. Financial Markets: Impact of Futures and Speculation
Paper barrels drive significant price volatility:
- Brent-WTI Spread: At roughly $3-$4, the spread reflects Brent’s exposure to seaborne and geopolitical risks versus WTI’s land-locked U.S. basis.
- Speculative Activity: Geopolitical uncertainties fuel hedge fund trading, accentuating price swings.
4. The Energy Transition: Shaping the Longer-Term Outlook
While less impactful day-to-day, renewables and climate policies steer Brent’s future trajectory:
- Capital Flight: Climate concerns divert investment away from fossil fuel projects, constraining future supply growth.
- Policy Changes: Electrification mandates, carbon pricing, and subsidies are dampening long-term oil demand.
Summary: Brent prices balance urgent geopolitical risks with longer-term structural shifts as global energy evolves.
Economic Impacts of Brent Prices in 2026
Brent’s price movements send ripples across oil-exporting and importing nations—and broader economies.
For Oil Exporters: Revenue Boosts and Fiscal Stability
Countries reliant on oil exports benefit directly from higher prices:
- Budget Support: Near $94 per barrel, exporters like Saudi Arabia and Nigeria see strengthened revenues funding government programs and economic diversification.
- Currency and Fiscal Health: Higher export earnings bolster currencies and fiscal room, evident in Russia and Angola.
For Oil Importers: Inflation and Growth Challenges
Energy-importing countries contend with rising costs:
- Inflationary Pressure: Elevated fuel costs feed into transportation and manufacturing, pushing consumer prices higher and challenging central banks to balance inflation and growth.
- Fiscal Strains: Subsidy programs to mitigate prices may widen deficits and delay energy infrastructure investment.
For Businesses and Consumers: Broader Economic Effects
- Higher Transportation Costs: Airlines, shipping, and trucking face margin pressure, often passing costs to consumers.
- Tighter Consumer Budgets: Increased fuel and heating expenses reduce discretionary spending, potentially impacting retail and services sectors.
Takeaway: Brent prices remain central to global inflation trends, fiscal balances, and economic growth outlooks.
Forecasting Brent Prices: Scenarios for 2026 and Beyond
Analysts offer several potential paths based on evolving risks and market dynamics.
Scenario 1: Diplomatic Breakthrough (Bearish to Neutral)
- Trigger: Signing of a US-Iran deal and Lebanon ceasefire.
- Impact: Risk premium drops $10-$15 per barrel.
- Outcome: Brent settles toward $85-$90, reflecting fundamentals without acute tensions.
Scenario 2: Status Quo Tension (Neutral to Slightly Bullish)
- Trigger: No conflict resolution; sporadic incidents continue.
- Impact: Ongoing $5-$8 per barrel risk premium.
- Outcome: Brent holds within $90-$100 range, volatile around inventory and OPEC+ news.
Scenario 3: Major Escalation (Bullish)
- Trigger: Significant conflict disrupting shipping or infrastructure.
- Impact: Sharp panic-driven price spikes.
- Outcome: Brent surges above $115-$130+, risking global economic disruption.
Longer-term, the energy transition is expected to cap upward price pressure despite short-term volatility.
Conclusion: Mastering the Brent Oil Market in 2026
The 2026 Brent oil price index embodies the complexity of modern global energy markets—driven by immediate geopolitical shocks, tight supply fundamentals, speculative dynamics, and the steady march of the energy transition.
Key Insights:
- Brent at ~$94 balances a fading war premium with tight inventories and persistent risk.
- Middle East geopolitics dominate volatility, especially around critical shipping routes.
- Supply fundamentals provide a firm price floor amid uncertainty.
- Energy transition policies restrain long-term demand and investment.
- Market volatility will likely persist, reflected in Brent-WTI spreads and rapid price swings.
Recommendations:
- Investors: Use scenario-based hedging; monitor inventories, geopolitical shifts, and Brent-WTI spreads.
- Businesses: Integrate oil price volatility into financial forecasts and supply chain strategies; consider hedging to mitigate risks.
- Policymakers: Leverage current relative stability to build strategic reserves and accelerate energy diversification efforts.
Understanding Brent’s signals is vital for navigating an energy world defined by conflict, transformation, and global interdependence.
Frequently Asked Questions (FAQ)
1. Why is Brent crude pricier than WTI in 2026?
Brent carries a $3-$4 premium because it is priced on seaborne deliveries vulnerable to geopolitical risks—especially in the Middle East and Atlantic shipping lanes. WTI, traded at a U.S. land hub, avoids much of this risk.
2. What does “minimum operating levels” in U.S. crude inventories mean?
This means storage has fallen to the lowest volumes needed to keep refiners and pipelines running smoothly, leaving little buffer against supply shocks and supporting higher global prices.
3. Could Brent fall below $80 in 2026?
Possible but unlikely without sustained geopolitical calm, recession-driven demand drops, and increased OPEC+ output given current tensions and tight stockpiles.
4. How does the energy transition influence Brent prices today?
By limiting capital for exploration and production and reshaping demand via electrification and renewables, the transition places a structural ceiling on future oil price growth.
5. Where to find reliable, up-to-date Brent price info?
Platforms like Investing.com and Trading Economics offer live prices and charts. The U.S. Energy Information Administration (EIA) provides weekly reports at eia.gov. For geopolitical analysis, consult Bloomberg, Reuters, and The Wall Street Journal. Official sources like OPEC and Saudi Aramco provide authoritative policy updates.