
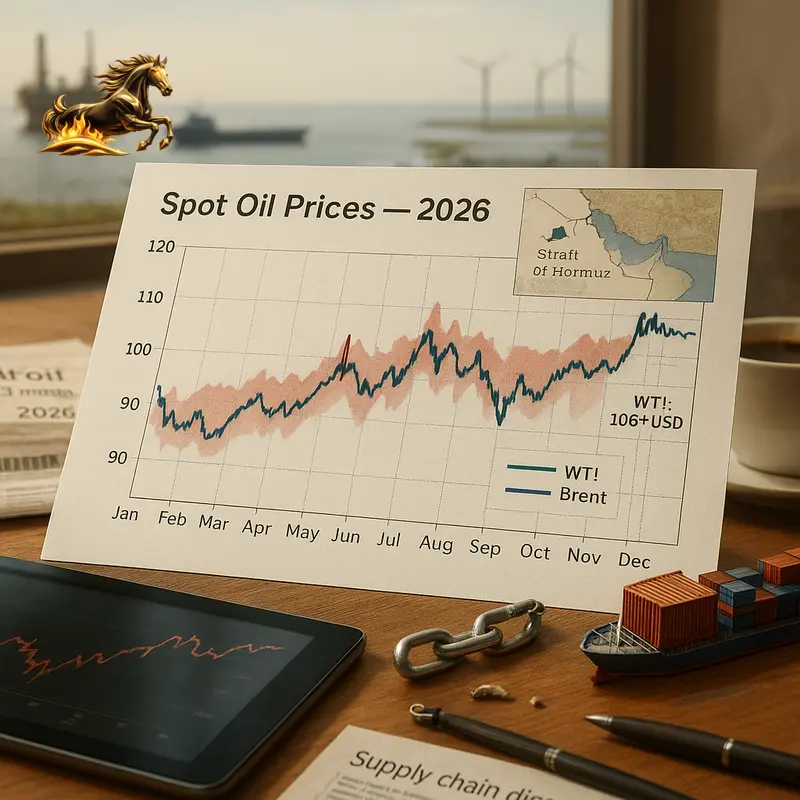
Understanding the 2026 Spot Oil Price Chart: Navigating Volatility in a New Era
The spot oil price chart is more than just numbers—it reflects the pulse of the global economy, capturing the delicate dance between supply and demand. In 2026, this chart reveals an especially intricate narrative shaped by geopolitical tensions, fragile supply chains, and a rapid energy transition. With West Texas Intermediate (WTI) soaring above $106 per barrel and Brent crude surpassing $111, the spot oil market signals disruption and uncertainty. This article breaks down the 2026 spot oil price chart, explaining its volatile trends and offering valuable insights for businesses, investors, and policymakers navigating today’s challenging energy landscape.
What Is the Spot Oil Price? The Market’s Real-Time Indicator
To understand price swings, it’s crucial to grasp what the spot oil price actually means.
Spot vs. Futures: Immediate Delivery vs. Future Contracts
Oil pricing mainly operates through two channels:
- Spot Price: The price for oil bought or sold for immediate delivery, usually within days. It reflects the current real supply-demand balance.
- Futures Price: The agreed price today for delivery at a specified future date (weeks or months ahead). Futures markets help hedge risks and fuel speculation, but don’t necessarily reflect physical trades today.
The spot price is the foundational benchmark shaping futures prices and real-world transactions.
Key Benchmarks: WTI and Brent
Spot price charts typically focus on two main benchmarks:
- West Texas Intermediate (WTI): A light, sweet crude priced at Cushing, Oklahoma, representing U.S. domestic supply and inventory dynamics.
- Brent Crude: The global benchmark sourced from the North Sea, reflecting seaborne oil trade and global geopolitical risks.
In 2026, the Brent-WTI spread has widened significantly, with Brent trading between $111 and $119 per barrel, while WTI hovers in the low $100s. This gap highlights location-specific risks, especially disruptions affecting maritime routes critical to Brent.
Why Spot Pricing Matters
Spot prices have a ripple effect because they:
- Indicate economic health: Rising spot prices often signal supply shocks; declines may reveal weakening demand.
- Drive consumer costs: They quickly influence gasoline prices, heating bills, and transportation expenses, impacting inflation.
- Reflect market sentiment: Sharp movements affect energy sector stocks, bonds, and currencies tied to oil exports.
Reading the spot price offers a real-time snapshot of current market tensions and economic impacts.
Decoding the 2026 Spot Oil Price Chart: Key Patterns
The spot oil price chart reveals the market’s underlying dynamics through specific patterns.
Curve Structure: Backwardation vs. Contango
The shape of the price curve between spot and futures prices says a lot:
- Backwardation: Occurs when spot prices exceed futures prices, indicating tight near-term supply. In 2026, backwardation dominates, reflecting a premium on immediate delivery amid geopolitical risks, embedding a “geopolitical premium.”
- Contango: When futures prices exceed spot prices, it signals expected oversupply or ample storage. Contango is largely absent this year due to constrained supply.
This curve analysis signals whether the market is currently tight or expecting easing.
Coordinated Physical Benchmark Rally
Beyond WTI and Brent, various regional crude grades—from Canada’s Central Alberta to U.S.’s High Sweet Clearbrook—have surged 4–5% daily in 2026. This broad-based rally confirms that supply-demand imbalances, not speculation, are driving prices—validating the spot price trend’s strength.
Intraday Volatility and Price Reporting Variations
Volatility is pronounced in 2026, with WTI spot prices fluctuating between about $101 and $108 in single sessions. Differences arise from distinct price definitions (real-time spot, front-month futures, delayed composites) and reporting speeds. During sudden events—like drone strikes or diplomatic setbacks—accurate understanding of price types is critical.
Why Are 2026 Spot Prices So Volatile?
Several intertwined factors fuel spot price swings this year.
Geopolitical Shock: Strait of Hormuz Closure
The major driver is the closure of the Strait of Hormuz, a vital oil chokepoint funneling roughly 20% of global seaborne crude. Ongoing US-Iran tensions have halted passage, pushing:
- WTI futures above $106 (+4.5% daily, 11% weekly gains)
- Brent crude over $111, reflecting heavier reliance on vulnerable seaborne routes
This disruption adds a sustained geopolitical risk premium and steepens the backwardated price curve.
Fragile Supply Chains and Regional Instability
Additional pressures include:
- Frequent drone attacks targeting Gulf oil infrastructure
- Ongoing uncertainty around conflict resolution
- Impact of the Russian-Ukrainian war straining Europe’s energy alternatives
Together, these reduce effective global supply and boost spot prices.
Structural Energy Transition Impact
While geopolitics dominate near-term pricing, the global energy transition—driven by renewables, electric vehicles, and efficiency gains—shapes longer-term outlooks. Uncertainty about future demand dampens investment in new oil production, tightening current supply despite shifting consumption patterns.
OPEC’s Market Stabilization Role
OPEC’s production decisions continue to influence supply-demand balance, tempering extreme price swings but unable to fully offset geopolitical shocks. Their role remains a key stabilizing factor amid broader volatility.
What the 2026 Spot Oil Price Chart Means for You
Spot price swings have real-world impacts across economies and sectors.
Economic Repercussions: Inflation and Growth
Higher spot oil prices raise transportation and manufacturing costs, fuelling inflation that burdens consumers and businesses. Central banks may tighten policy, slowing growth. Conversely, sharp price drops can indicate economic weakness affecting oil-exporting countries’ revenues.
Winners and Losers by Sector
- Transportation & Aviation: Face margin pressure from fuel cost spikes, leading to higher travel and shipping prices.
- Chemical & Manufacturing: Increased feedstock costs raise production expenses for plastics, fertilizers, and more.
- Energy Producers: Benefit from higher prices, though operational costs rise too. Widening Brent-WTI spreads create winners and losers regionally.
Consumer Impact: From Gas Pumps to Home Heating Bills
Spot price changes flow through to consumers via:
- Gasoline prices adjusting within one to two weeks post crude price moves.
- Higher heating oil and utility bills.
- Broader inflationary pressures affecting household budgets.
Reading Beyond Today: Forecasting Spot Prices in 2026
While the spot chart captures current trends, forecasting demands robust modeling.
Forecasting Tools Amid Uncertainty
Analysts integrate historical data, economic indicators, geopolitical risks, and supply-demand forecasts. Yet unexpected geopolitical shocks keep 2026 models flexible.
Potential 2026 Scenarios
- Prolonged Disruption: Strait of Hormuz remains closed; persistent backwardation and volatility continue.
- Diplomatic Resolution: Passage reopens; prices correct and curve normalizes as supply recovers.
- Accelerated Energy Transition: Long-term futures drop on demand concerns, but spot prices stay high due to short-term crises, causing curve divergences.
Long-Term Energy Transition Effects
Over decades, the energy transition is likely to lower average oil prices, though volatility may spike during adjustment phases due to supply-demand mismatches.
Leveraging the Spot Oil Price Chart for Strategic Decisions
The spot price chart is a crucial tool for multiple stakeholders.
For Businesses and Procurement
- Hedging: Use backwardation to lock favorable future prices.
- Inventory: Balance stockpiling with exposure minimization during price spikes.
- Budgeting: Incorporate spot trends to forecast input costs and adjust pricing proactively.
For Investors and Traders
- Spread Trading: Track Brent-WTI gaps for regional risk insights.
- Curve Analysis: Gauge immediate supply tightness through backwardation.
- Risk Management: Prepare for sharp intraday price swings.
For Policymakers and Planners
- Inflation Monitoring: Spot price surges signal inflationary pressures to address.
- Energy Security: Use elevated prices to justify diversification and strategic reserves.
- Transition Planning: Balance short-term volatility with long-term decarbonization goals.
Conclusion: Mastering the 2026 Spot Oil Price Chart
The 2026 spot oil price chart tells a story of a market under strain—shaped by strategic chokepoint closures, geopolitical risks, and energy transformation. Key signals like pronounced backwardation, the widening Brent-WTI spread, and broad physical crude price rallies highlight fragile oil flows.
Understanding and interpreting this chart empowers businesses, investors, and policymakers to respond smartly to price signals and emerging risks. The spot oil price chart isn’t just data—it’s a strategic compass guiding you through the complexities shaping our global energy future.
Key Takeaways
- The spot oil price reflects immediate physical delivery, currently high due to the Strait of Hormuz closure and geopolitical tensions.
- The spot-futures curve shows backwardation, indicating tight near-term supply.
- Diverse physical crude benchmarks confirm genuine supply-demand pressure behind price rises.
- The Brent-WTI spread widens, reflecting elevated risks in seaborne crude trade.
- The global energy transition shapes investment and long-term price expectations amid short-term volatility.
- Volatile markets underscore the importance of knowing your price type—spot, futures, or composites—when reviewing charts.
Practical Next Steps
- Use Multiple Data Sources: Combine trusted platforms for clarity during volatility.
- Monitor Physical Benchmarks: Track regional crude prices alongside WTI and Brent.
- Analyze the Full Curve: Review futures prices for market expectations.
- Incorporate Geopolitical Risk: Regularly assess chokepoint risks in market analyses.
- Develop Scenario Plans: Prepare for both sustained disruption and diplomatic breakthroughs.
Mastering the 2026 spot oil price chart equips you with the insight needed to turn volatility into opportunity.
Frequently Asked Questions (FAQ)
Q1: What’s the difference between spot prices and news-reported prices?
News often cites front-month futures, while spot prices reflect immediate delivery and can exceed futures during supply shortages.
Q2: Why is Brent pricier than WTI in 2026?
The Brent-WTI price gap stems from location risks—Brent is more exposed to the Strait of Hormuz closure affecting seaborne oil, while WTI’s inland position offers insulation.
Q3: How quickly do spot price changes affect gasoline prices?
Typically within one to two weeks, depending on refinery and inventory levels.
Q4: Can spot prices predict long-term oil trends?
Spot prices capture current conditions; long-term trends depend on investment, policy, and demand projections, though persistent backwardation signals structural tightness.
Q5: What’s the clearest indicator of market stress on the chart?
A steep backwardated curve—when spot prices notably exceed futures—signals acute supply scarcity and heightened tension.
Understanding the 2026 spot oil price chart arms you with the strategic knowledge to navigate an uncertain energy market confidently.