
body {
font-family: -apple-system, BlinkMacSystemFont, “Segoe UI”, Roboto, Oxygen,
Ubuntu, Cantarell, “Open Sans”, “Helvetica Neue”, sans-serif;
color: #222;
padding: 1.5rem;
max-width: 800px;
margin: auto;
line-height: 1.6;
background: #fefefe;
}
h1.chi› {
font-size: 2.5rem;
font-weight: 700;
margin-bottom: 1rem;
color: #004080;
border-bottom: 3px solid #004080;
padding-bottom: 0.3rem;
}
h2 {
color: #0263c7;
margin-top: 2.5rem;
margin-bottom: 1rem;
border-bottom: 2px solid #dbe9ff;
padding-bottom: 0.25rem;
}
h3 {
color: #034a99;
margin-top: 1.5rem;
margin-bottom: 0.75rem;
}
strong {
color: #003366;
}
hr {
border: none;
border-top: 1px solid #d8d8d8;
margin: 2rem 0;
}
ul {
margin-left: 1.2rem;
margin-bottom: 1.3rem;
}
ul li {
margin-bottom: 0.5rem;
}
blockquote {
padding: 0.8rem 1.2rem;
margin: 1.5rem 0;
background: #e8f0ff;
border-left: 5px solid #52a0ff;
color: #004080;
font-style: italic;
}
.faq-section {
background: #f6faff;
border: 1px solid #d0e3ff;
padding: 1rem 1.2rem;
border-radius: 6px;
}
.faq-section strong {
display: block;
margin-top: 1rem;
color: #034a99;
}
NYMEX Crude Live Chart: Your Essential Guide to
NYMEX Crude Live Chart: Your Essential Guide to Trading Oil in 2026
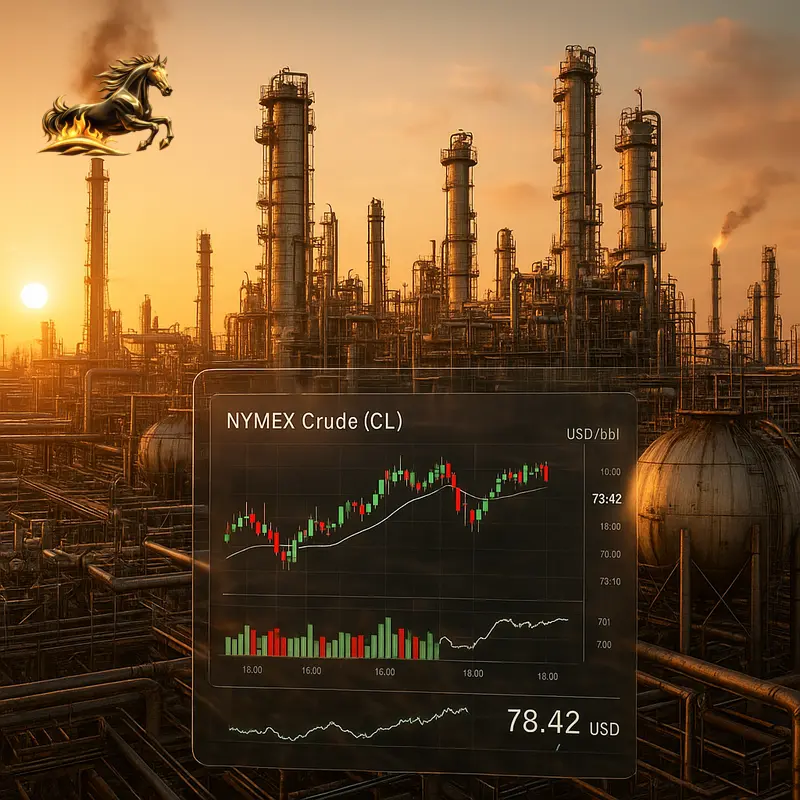
In 2026, trading oil is far more than simply watching a number flicker on a screen—it’s engaging with a dynamic story shaped by geopolitics, economics, and cutting-edge technology. The NYMEX crude live chart offers traders an immediate window into West Texas Intermediate (WTI) crude oil futures prices, reflecting real-time market reactions to events as varied as tensions in the Strait of Hormuz and shifts in global energy policy. With prices capable of swinging 5% in just a week from a single headline, mastering how to read and apply data from the live chart isn’t optional—it’s essential. This comprehensive guide breaks down how the NYMEX WTI market operates, highlights tech advances powering live charts in 2026, and shares practical strategies to confidently navigate oil’s volatile terrain.
Understanding the NYMEX Crude Oil Market
The New York Mercantile Exchange (NYMEX), part of the CME Group, stands as a cornerstone for oil pricing in North America and influences global markets. Here, traders buy and sell futures contracts for West Texas Intermediate (WTI) crude oil—each contract representing 1,000 barrels deliverable at a future date. But NYMEX futures aren’t mere promises to exchange physical barrels; they’re vital tools for risk management, speculation, and price discovery.
NYMEX WTI: A Key Global Benchmark
While Brent crude dominates global pricing, WTI remains central to U.S. benchmarks and is deeply influenced by key producing regions like the Permian Basin. The price of WTI directly affects fuel costs, energy sector health, and strategic decisions on reserves and exports. Futures contracts trade on anticipated supply and demand months ahead, making the NYMEX WTI price a forward-looking barometer—not just a snapshot of current physical transactions.
How Futures Trading Drives the Live Chart
The live chart updates with every trade executed, showing the market’s evolving consensus on WTI’s value. Strong liquidity in the NYMEX futures space ensures reliability and limits manipulation risks. Transparency is key—each trade is recorded and visible to participants, with near-continuous trading incorporating geopolitical events, economic releases, and unexpected shocks into price moves almost instantly.
In short: The NYMEX crude live chart is a pulsating reflection of countless trades and global forces, providing the most accurate real-time gauge of market sentiment for WTI crude oil.
The Evolution and Critical Role of Live Charts in 2026
Trading oil in 2026 means harnessing a sophisticated stream of real-time data where timing is everything and information flows ceaselessly into powerful analytical tools.
Real-Time Data: The New Trading Imperative
News travels lightning-fast, compressing decision timelines dramatically. Events that once took days to ripple through prices now impact trading algorithms and investor sentiment within seconds. For example, the recent spike above $72 per barrel triggered by U.S.-Iran tensions was tracked live—giving savvy traders the ability to enter or exit positions rapidly, advantages impossible with delayed or summary data.
Beyond Price Lines: Technological Integration
Modern live charts aren’t just visual price lines—they’re interactive platforms packed with:
- Advanced Predictive Analytics: Machine learning sifts through news, satellite imagery, and historic price trends to forecast support/resistance zones and detect unusual trade patterns.
- Multi-Timeframe Views: Traders can seamlessly toggle between granular tick charts and broader weekly illustrations to analyze short-term volatility and long-term trends.
- Custom Alerts: Personalized notifications for price triggers, volume surges, or volatility shifts ensure traders react instantly to evolving market conditions.
Bottom line: Today’s live charts are sophisticated decision engines that empower traders to move swiftly and smartly in a fast-paced market.
Key Drivers Behind the NYMEX Crude Chart in 2026
Interpreting the NYMEX crude live chart means grasping the complex factors influencing price moves as they unfold in real time—from geopolitical shocks to economic signals and the ongoing energy transition.
Geopolitical Turmoil: The Prime Volatility Engine
Political events are still the main catalysts for sudden price swings:
- Strait of Hormuz Tensions: Attacks on tankers or military incidents in this vital chokepoint—responsible for about 20% of global oil shipments—trigger immediate price jumps reflecting heightened risk premiums.
- U.S. Policy Shifts: Moves like ending Iran export waivers or military operations stoke fears of supply disruptions, spurring rapid price rallies.
- OPEC+ Actions: Decisions on production levels by this oil-controlling cartel often lead to significant market moves, sometimes defying initial expectations.
Economic Data and Demand-Side Signals
Charts also embed demand dynamics driven by economic indicators:
- Rising industrial output and transportation activity support higher WTI prices.
- On the flip side, Saudi Aramco’s recent price cut for Asian buyers signals softer demand in key markets, dampening price momentum despite geopolitical fears.
Energy Transition: The Slow-Burning Pressure
Longer-term, structural forces weigh heavily:
- Growing adoption of electric vehicles and renewable energy tempers crude demand growth.
- Oil companies investing in clean tech signal strategic shifts factoring into market pricing.
- Regulatory policies addressing emissions create uncertainties that influence longer-dated futures and demand forecasts.
In essence: The NYMEX crude live chart blends immediate reactions with deeper fundamental forces shaping the oil market’s future.
Mastering Trading Strategies Using the NYMEX Live Chart
A live chart is a powerful tool—but its value depends on savvy interpretation and discipline.
Technical Analysis: Decoding the Chart Language
Chart-focused traders rely on patterns and indicators to guide moves:
- Pinpointing support and resistance areas, like the recent $69–$72 range, to forecast reversals.
- Using momentum indicators such as RSI and MACD to determine if a price move is sustainable or overextended.
- Watching for volume spikes that confirm the strength of moves amid geopolitical news.
Fundamental Analysis: Linking Price to Real-World News
Fundamental traders connect chart movements with actual market drivers:
- Tracking price jumps tied to Iranian geopolitical tensions,
- Assessing whether moves reflect fleeting risk premiums or longer-term supply disruptions,
- Comparing these with demand signals like Aramco’s pricing strategies,
- Deciding trading positions based on this integrated perspective.
Sentiment & Momentum Trading in a Rapid News Cycle
In an environment where headlines move markets:
- Some traders exploit immediate reactions with swift, disciplined entries and exits to avoid reversals.
- Monitoring institutional volume flows helps anticipate significant market swings.
Risk Management: Your Trading Backbone
Protecting your capital amid oil’s notorious volatility is non-negotiable.
- Setting prudent stop-loss orders aligned with recent price swings limits losses.
- Spotting volatility spikes from the live chart helps adjust position sizes and reduce risk exposure.
Summary: Successful trading blends technical savvy, fundamental context, awareness of market sentiment, and rigorous risk controls.
The Future Outlook for NYMEX Crude Trading in 2026 and Beyond
Looking forward, NYMEX crude live charts remain essential tools amid an ever-evolving energy landscape.
Old Energy Meets New
Crude oil remains crucial for transport and industry but increasingly competes with renewables and improved efficiency. Price charts will reflect sharp short-term swings against a backdrop of structural demand challenges.
Heightened Volatility from Competing Forces
Expect persistent or intensified volatility as geopolitical instability pushes prices up, while energy transitions and tech advancements apply downward pressure. This tug-of-war fuels frequent, sometimes dramatic intraday movements.
Data Integration: The Ultimate Competitive Edge
Top traders will merge diverse data streams—satellite imagery, inventory stats, live news, and economic forecasts—using the live chart price as their decision anchor. This holistic method will define trading success.
Conclusion: Confidently Navigating the 2026 Oil Market
The NYMEX crude live chart narrates a complex story of global politics, economics, and innovation. Mastering this unfolding narrative means combining insight into geopolitical risks, understanding fundamental demand, leveraging advanced live chart tools, and applying disciplined risk management.
Key Takeaways:
- Geopolitical events drive swift, significant price volatility visible on the live chart.
- Balance headline-driven price moves with deeper supply and demand fundamentals.
- Use advanced live chart features for timely, actionable intelligence.
- Prioritize risk management to safeguard capital amid frequent major swings.
- Analyze multiple timeframes to distinguish noise from lasting trends.
Get Started: Choose a reliable platform with real-time NYMEX crude (CL) charts. Monitor price movements during key news, track your observations, and practice strategies in a risk-free setting before trading live. In 2026, informed, disciplined, and agile traders gain the upper hand.
Frequently Asked Questions (FAQ)
It shows continuously updated prices of the nearest-month West Texas Intermediate (WTI) crude oil futures contract (ticker CL), reflecting the market’s real-time valuation of crude oil.
Q2: Why did WTI prices recently surge above $72 per barrel?
The spike was driven by geopolitical risk premiums from U.S. military actions against Iran, the removal of Iran export waivers, and attacks in the Strait of Hormuz, raising concerns over possible supply disruptions.
Q3: How does Saudi Aramco’s price cut affect NYMEX WTI prices?
Saudi Aramco cutting prices signals weaker demand or increased market competition, especially in Asia, which can limit upward momentum in global benchmarks like WTI.
Q4: What’s the difference between trading the live chart and investing in oil?
Trading focuses on short- to medium-term futures or CFD price movements, while investing generally targets long-term holdings in stocks, ETFs, or physical assets for steady returns.
Q5: What are the major risks when trading based on the live crude oil chart?
High volatility and leveraged futures positions can cause quick, unpredictable price swings—making strict risk controls such as stop-loss orders crucial.
