
Brent Crude Price Live in 2026: Your Complete Guide to Understanding, Tracking, and Making Sense of Today’s Oil Market
Introduction: The Pulse of the Global Economy
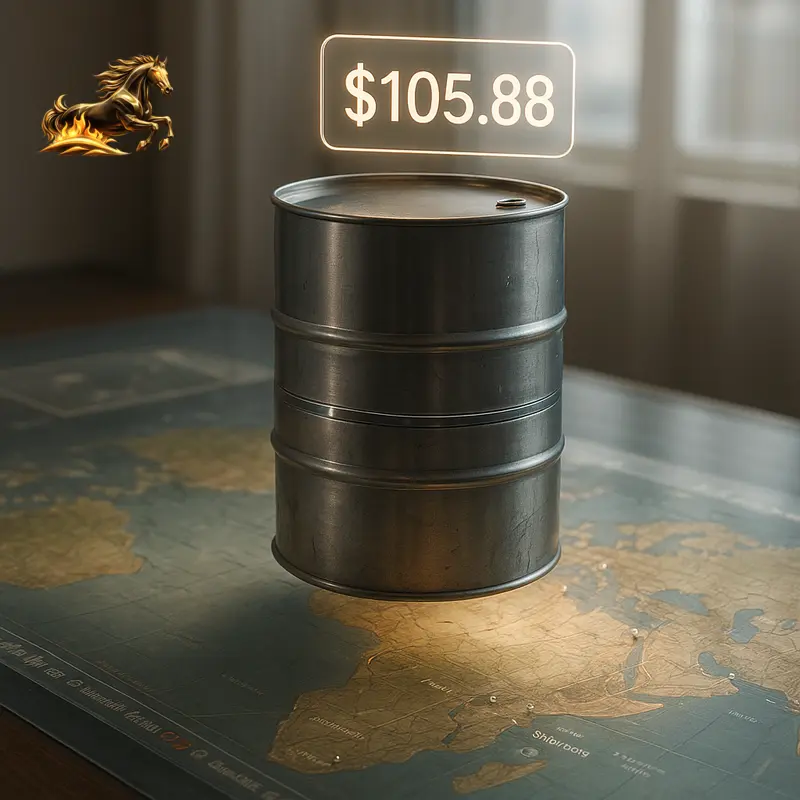
Every day, the global economy beats to the rhythm of Brent crude oil prices. On April 24, 2026, Brent crude settled at $105.88 per barrel, up 0.77% from the previous day and soaring 60.91% since January, according to Trading Economics. These aren’t just numbers—they shape everything from your morning commute to international relations.
Why should Brent crude’s price matter to you—even outside the oil sector? Because Brent is the global benchmark for oil pricing. It influences inflation, corporate earnings, government choices, and geopolitical stability worldwide. Today’s oil market isn’t just about supply and demand; it’s shaped by the energy transition, AI-powered trading, and shifting geopolitical dynamics.
This guide will walk you through:
- How to get accurate, real-time Brent crude price updates
- Factors behind Brent’s climb above $100 per barrel
- What distinguishes today’s oil market from past cycles
- How to read the price signals that really matter
- Why futures and physical market prices can differ—and what that means
- How Brent prices impact your portfolio, business, and daily life
Getting a clear picture of Brent crude prices in 2026 means understanding the forces reshaping the world economy. Let’s dive in.
What Is Brent Crude and Why It’s More Crucial Than Ever
The World’s Leading Oil Pricing Benchmark
Brent crude began as a blend of light, sweet North Sea oils—Brent, Forties, Oseberg, and Ekofisk, known collectively as BFOE. Today, “Brent” is the cornerstone of about 70% of internationally traded crude oil contracts.
In 2026, Brent pricing is no longer just about North Sea fields. It reflects a global balance of supply and demand, serving as a key gauge for central banks and policymakers tracking inflation, economic health, and geopolitical tension.
Brent’s 2026 significance includes:
- Being the global pricing standard shaping oil contracts worldwide
- Acting as a leading inflation gauge
- Serving as an economic health indicator when GDP reports fall short
- Reflecting geopolitical risk premiums amid ongoing conflicts and supply vulnerabilities
Brent and the Energy Transition: A Complex Relationship
While renewable energy is growing rapidly, Brent crude remains pivotal. Global oil demand rises due to emerging markets, recovering air travel, and expanding petrochemical use. At the same time, ESG pressures limit new oil investments, creating a “great energy paradox” of rising demand amid restricted supply. Brent prices vividly capture this delicate balance, highlighting the transition’s challenges.
April 2026 Market Snapshot: Brent Crude Price Live
Key figures as of April 24, 2026:
- Spot Price: $105.88 per barrel
- Futures Price: $105.33 per barrel
- Daily Trading Range: $103.41 – $107.48
- Year-to-Date Change: +60.91%
- 52-Week Range: $58.50 – $119.50
- Trading Volume: 263,154 contracts
- Open Interest: 571,342 contracts
The surge echoes post-2008 levels, but beneath the surface lies a critical gap: While futures hover near $105, physical Brent spiked to $141.36 in early April. This disconnect reveals important distortions in oil’s true market cost.
Why the Futures-Physical Price Gap Matters
Futures contracts reflect expectations, speculation, and hedging around oil delivery dates. Physical spot prices show the immediate cost refiners and industries pay.
The 35% premium on physical Brent signals tight supply invisible to futures markets. This divergence means:
- Companies face higher real-time costs than futures suggest
- Policymakers may underestimate inflation risks
- Investors might misread energy sector valuations
- Market stability could be threatened by misleading indicators
Recognizing this split is essential for anyone tracking Brent crude prices live.
The Five Key Drivers Behind Brent Prices in 2026
1. Geopolitical Risks in a Multipolar World
Tensions in the Middle East, Arctic claims, and critical chokepoints like the Strait of Hormuz embed risk premiums of $15–25 per barrel into Brent prices, reflecting supply uncertainty.
2. Underinvestment Amid Rising Demand
ESG mandates and regulatory uncertainty have caused one of the worst investment droughts in oil history. Meanwhile, steady demand growth of around 1–1.5 million barrels daily tightens supply and fuels price gains.
3. Currency Shifts Affecting Oil Pricing
The U.S. dollar’s dominance in oil trade faces challenges as exporters accept alternative and digital currencies, increasing price volatility and complicating trade finance.
4. Energy Transition Realities
Despite renewable advances, oil’s energy density and entrenched infrastructure keep demand firm. Intermittent renewables require fossil fuel backup, sustaining market tightness longer than expected.
5. Financialization and Algorithmic Trading
With Brent futures trading volume around 30 times physical supply, financial flows dominate prices. Algorithmic trades account for 70%+ of futures volume, causing sharp swings and risks reminiscent of flash crashes.
How to Track Brent Crude Price Live: Your 2026 Toolkit
Stay ahead with reliable, real-time resources:
Top Websites & Platforms
- Trading Economics: Real-time prices plus rich historical data
- Investing.com: Live futures, charts, and market sentiment
- Intercontinental Exchange (ICE): Official Brent futures pricing for professionals
- MarketWatch: Continuous updates with market news
- OilPrice.com: Price data plus in-depth energy analysis
Mobile Apps for On-the-Go
- Oil Price Live App: Real-time Brent and WTI tracking
- Investing.com Mobile: Alerts, charts, and portfolio tools
- CNBC Pro: Premium quotes and expert commentary
Pro Tools for Deep Insights
- Bloomberg Terminal: Gold standard for detailed market analytics
- Refinitiv Eikon: Advanced datasets and forward curves
- Platts Oil Analytics: Focused on physical market conditions
Beyond Price: Essential Metrics to Watch
- Futures curve shapes (backwardation or contango)
- Time spreads signaling short-term tightness
- Crack spreads for refining margins
- Regional price differentials
- Implied volatility from options
- Open interest and volume indicating market conviction
Brent Price Volatility: The New Normal in 2026
A 52-week price swing from $58.50 to $119.50 reveals oil’s intensified volatility—40% higher than the 20-year average. Factors include rapid information flow, complex geopolitics, unpredictable climate policies, and cyclical investment trends.
Managing Volatility Effectively
- Consumers and businesses: Use hedging, flexible contracts, and build inventories
- Investors: Leverage options and structured products to balance risk and reward
- Policymakers: Maintain strategic reserves and foster international cooperation
The Physical Market Reality: Why Brent Spot Price Counts
With physical Brent cargoes at $141.36 in April, supply stress is severe. Logistical issues, refinery maintenance, shipping delays, and tight trade finance amplify this physical-futures gap, compressing margins and complicating hedging.
Forward Price Curve Insights: What the Market Predicts
Brent’s current backwardation—higher near-term prices than later months—signals supply tightness now but some expectation of easing. This guides trading and policy on inventory and transition planning.
Regional Price Differentials: Brent vs. Other Benchmarks
- Brent trades about $11 above WTI due to U.S. transport limits despite shale output
- Brent-Dubai spreads reflect Middle East pricing tactics targeting Asia
- Unusual gaps between Dated Brent and Brent futures spotlight physical vs. financial market tensions
These spreads offer trading chances and reveal supply chain pressures.
Economic Impact at $105+ Brent
- Exporters: Gain fiscal stability but face diversification challenges
- Importers: Battle inflation and growth slowdowns
- Industries: Transportation costs rise while energy sectors benefit
- Society: Vulnerable groups bear disproportionate burdens, risking social unrest
Navigating these effects demands nuanced, adaptive strategies.
Strategic Advice for Businesses and Investors
For Companies
- Update hedging to fit heightened volatility
- Bolster supply chain resilience and inventory management
- Assess pricing power carefully to sustain demand
For Investors
- Favor energy sector exposure with strong fundamentals
- Use risk tools like options and tactical allocation
- Balance ESG goals with pragmatic energy market realities
Looking Ahead: Brent Price Scenarios Through 2026
- Base Case ($95–115): Moderate tightness and demand growth expected by most analysts
- Bull Case ($120–150+): Geopolitical shocks or slow renewables could spike prices (30% chance)
- Bear Case ($70–90): Economic slows or supply boosts could soften prices (20% chance)
Investment cycles and transition progress will shape future price paths.
Conclusion: Mastering the Complex Brent Crude Landscape in 2026
Brent crude pricing today reflects a world in flux. Geopolitics, market structure, energy transition, and physical supply challenges all collide, creating volatility as the new normal and complex physical-futures market splits.
Success requires:
- Going beyond headline prices to track deep market signals
- Understanding drivers shaping supply, demand, and risk premiums
- Embracing flexible, scenario-based strategies
- Staying alert to rapid changes in fundamentals
Whether investor, business leader, or engaged citizen—knowing Brent crude’s dynamics in 2026 is essential to managing risk and grabbing opportunity in this vital global market.