
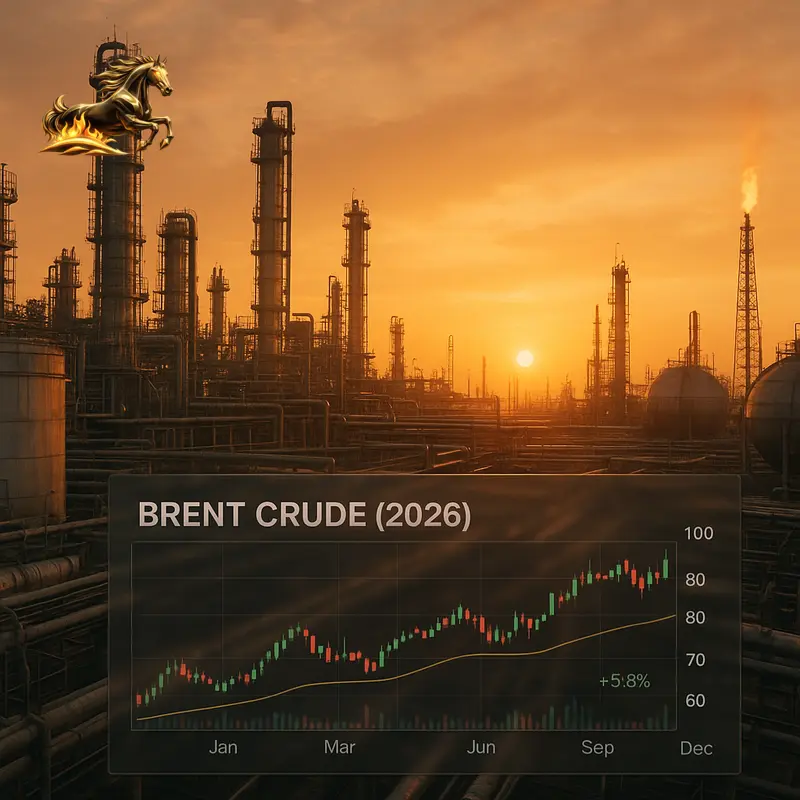
The Brent Crude Oil Price Chart in 2026: Your Complete Guide to Market Moves, Risks, and Forecasts
For anyone involved in global markets—whether you’re a trader, economist, or policy watcher—the Brent crude oil price chart is far more than just a line graph. Each price movement tells a story shaped by geopolitics, supply chain shifts, and investor sentiment. In 2026, this story is especially vivid, with Brent prices breaking key psychological thresholds amid rising geopolitical tensions. Understanding these forces behind the Brent crude price chart is essential not only for smart financial decisions but also for grasping the bigger economic picture that affects our daily lives. This guide unpacks the main factors driving Brent crude this year and what they could mean down the road.
Why Brent Crude Remains a Market Bellwether in 2026
To appreciate the importance of Brent crude, you need to know its role in global energy markets. Sourced from the North Sea, Brent is the primary pricing benchmark for about two-thirds of internationally traded crude oil. It sets the tone for European, African, and Middle Eastern markets, influencing fuel prices and industrial profitability worldwide.
Despite fast growth in renewables, the global economy still relies heavily on hydrocarbons for transportation, manufacturing, and petrochemicals. Brent prices thus act as a crucial economic indicator. Rising prices often hint at tightening supply, growing demand, or geopolitical uncertainty, while falling prices might reflect economic slowdowns or oversupply. Watching the Brent crude price chart offers early insight into how these global trends unfold.
Breaking News: Geopolitical Shocks Push Brent Above $90
A major recent development sent Brent prices sharply higher. In early September 2026, Brent crude surged past $90 per barrel, reaching about $91.23 on September 1, according to Trading Economics. This spike came on the back of escalating tensions between the U.S. and Iran, stoking fresh fears of supply disruptions.
The trigger was U.S. military strikes on Iranian rocket launchers on Larak Island in the Persian Gulf—the first direct confrontation in nearly a month. This conflict introduced a “war-risk premium” to oil markets, as traders worried about the security of shipments through this vital region.
Central to these concerns is the Strait of Hormuz, a narrow maritime chokepoint through which roughly 25% of the world’s seaborne oil passes, including exports from Kuwait, Qatar, and the UAE. Any threat to this route tends to send prices soaring because it jeopardizes global oil flows. With no ceasefire in sight, markets remain jittery, and that anxiety is now baked into Brent’s elevated pricing.
How to Read the 2026 Brent Crude Price Chart: Key Technical and Fundamental Levels
At first glance, a price chart might appear to be just a line zigzagging up and down. Yet investors see a wealth of strategic signals in these movements.
The $90 Breakout: A Psychological and Technical Milestone
- Psychological Impact: Round numbers like $90 capture market attention and can trigger buying from momentum traders.
- Technical Breakthrough: $90 had acted as resistance, holding prices back. Breaking through signals strong bullish momentum, potentially opening the door to further gains. Analysts are closely watching if Brent can hold above this level or if it will pull back.
Support and Resistance Zones to Watch
- New Support: The old resistance zone between $88 and $90 now acts as key support. Investors will look to this range to gauge if the breakout is solid.
- Next Resistance: If the rally continues, watch for resistance around $95 and then $100 per barrel—the latter last seen during major spikes in the early 2020s.
Volume and Momentum Confirmations
Strong moves gain credibility when backed by high trading volumes. The surge past $90, fueled by geopolitical news, likely saw heightened market activity. Momentum indicators like the Relative Strength Index (RSI) help signal if prices become overbought, possibly hinting at a short-term correction.
The Main Drivers Behind Brent Prices in 2026
To make sense of the Brent crude price chart, it’s vital to understand what’s behind the numbers:
1. Geopolitical Factors: The Ever-Present Price Driver
- Middle East Volatility: Beyond U.S.-Iran tensions, instability in Iraq, Libya, and the Gulf Cooperation Council countries keep markets on alert.
- OPEC+ Decisions: Saudi Arabia, Russia, and allies control production levels that can shift prices instantly.
- Russia’s Role: Sanctions and “shadow fleets” add complexity to Russia’s export volumes, injecting uncertainty into supply forecasts.
2. Supply and Demand: The Market’s Core Dynamic
- Global Demand: Growth in emerging Asian markets, including India and Southeast Asia, significantly influences demand. Economic slowdowns could weaken demand, while robust growth tightens the market.
- Supply Constraints: Underinvestment post-2020 price crash plus slower U.S. shale growth and big oil’s focus on returns over volume create tighter supply conditions.
3. Energy Transition: Shaping Future Demand
- Peak Demand Expectations: Forecasts foresee a peak and eventual decline in oil demand due to efficiency gains and fuel switching.
- Investment Shifts: ESG mandates limit fossil fuel investments, raising costs for oil companies and potentially restricting supply growth.
4. The U.S. Dollar and Financial Markets
- Strong Dollar: Makes oil costlier for other countries, possibly dampening demand.
- Weak Dollar: Lowers relative prices, often supporting higher consumption and prices.
Oil also responds to global market sentiment, frequently moving in correlation with equities and commodities.
Analyst Forecasts for Brent Crude in 2026
Where could Brent prices head next? Analysts offer varied perspectives but largely show cautious optimism:
- Short-Term: Trading Economics projects Brent around $91.72 by the end of the quarter, with prices supported by geopolitical risks.
- 12-Month Outlook: Forecasts near $106.71 anticipate ongoing supply tightness or geopolitical tensions. These depend heavily on real-world developments.
- Scenario Range:
- Bullish: Rising tensions and demand push prices above $100.
- Base: Balanced supply and moderate risks keep prices between $85 and $95.
- Bearish: Conflict resolution and supply boosts could drive prices below $80.
Navigating Brent Price Volatility: Tips for Different Stakeholders
Investors and Traders
- Diversify: Avoid concentrated exposure to oil’s volatility by mixing assets.
- Hedge Smartly: Use futures and options to manage risk.
- Stay Informed: Base decisions on solid analysis, not knee-jerk reactions to headlines.
Businesses (Transport, Manufacturing, Airlines)
- Hedge Fuel Costs: Futures or options contracts secure price certainty.
- Plan Supply Chains: Geographic and supplier diversification plus inventory buffers reduce cost shocks.
Policymakers and Governments
- Prioritize Energy Security: Strategic reserves and diversified energy reduce risk.
- Manage Inflation: Monitor oil-driven inflation impacts carefully.
Everyday Consumers
- Budget Smarter: Higher oil costs raise gasoline and product prices.
- Consider Long-Term Options: Fuel-efficient or electric vehicles help shield against future price swings.
The Big Picture: Brent Crude Amid Global Transition
The Brent crude price chart in 2026 captures a world caught between enduring geopolitical upheavals and a gradual energy transition. This duality ensures ongoing volatility—sharp price spikes from conflicts followed by reassessments and market corrections.
Brent’s trajectory is unlikely to be linear. Instead, expect a rhythm of peaks and plateaus as short- to medium-term bullish fundamentals clash with long-term structural shifts.
Mastering the Brent price chart means synthesizing diverse signals—from political developments and OPEC moves to energy forecasts and financial indicators—into a coherent view of immediate risks and future trends.
Key Takeaways & Next Steps
The September 2026 breakout above $90 marks a defining moment shaped by real-world conflict and market dynamics. Oil remains a geopolitically sensitive commodity.
- U.S.-Iran tensions dominate near-term price moves.
- The $90 level has flipped from resistance into key support.
- Analysts lean cautiously bullish but warn risks persist.
- Energy transition cools long-term demand but not short-term volatility.
- Volatility is the new normal; risk management beats reaction.
What you can do next:
- Follow reliable live Brent crude oil price charts and energy news.
- Monitor authoritative supply-demand reports from the EIA and IEA.
- For businesses, review risk management and hedging strategies fitting the volatile environment.
Understanding the Brent crude oil price chart equips you to better navigate the global energy and economic landscape in 2026 and beyond.
Frequently Asked Questions (FAQ)
- 1. What’s the difference between Brent Crude and WTI crude oil?
- Brent Crude comes from the North Sea and benchmarks global oil prices across Europe, Africa, and the Middle East. West Texas Intermediate (WTI), sourced in the U.S., benchmarks mostly North American oil. Brent tends to reflect geopolitical risks more directly, while WTI is more influenced by U.S. domestic factors like inventory levels and infrastructure.
- 2. Why did Brent prices surge sharply in September 2026?
- The surge followed U.S. strikes on Iranian military targets on Larak Island, which raised fears about the security of the Strait of Hormuz—a critical oil transit route—prompting traders to factor in a “war-risk premium.”
- 3. Where can I find reliable live Brent crude oil price charts?
- Sites like Trading Economics, Investing.com, and Yahoo Finance offer free, up-to-date charts. For deeper analysis and historical data, platforms such as Bloomberg Terminal and Refinitiv Eikon are top-tier.
- 4. How do high Brent crude prices affect consumers?
- Higher oil prices increase gasoline and diesel costs, raising transportation and goods prices, which can drive inflation and pressure household budgets.
- 5. Are current high Brent prices sustainable or likely to crash?
- Sustainability depends on geopolitical and supply-demand developments. If tensions ease and supply rises, prices may fall. However, ongoing supply constraints and geopolitical risks could keep prices elevated. A sharp crash would need a major economic slowdown or coordinated production increases.
Master the Brent crude oil price chart and you unlock vital insights into the forces shaping 2026’s global economy—a must-know for investors, businesses, policymakers, and consumers alike.
