
Brent Oil Stock Chart 2026: A Deep Dive
As we move through 2026, the Brent Crude Oil market remains a focal point for global energy and financial conversations. The Brent oil stock chart does far more than track prices—it reflects intricate forces such as supply limitations, geopolitical tensions, and shifting market sentiment. As of mid-May 2026, Brent has stabilized around $106 per barrel, marking a remarkable 7.5% rally over just three sessions and nearly a 60% increase over the past year. These trends signal a fundamental shift in the market, making it essential for investors, traders, and analysts to grasp the key drivers behind this pivotal chart.
This post offers a detailed examination of the 2026 Brent oil chart, unpacking recent price behavior, analyzing supply and demand dynamics, interpreting crucial technical patterns, and suggesting strategies to confidently navigate what lies ahead. Whether your focus is on futures, energy stocks, or global economic trends, the Brent oil stock chart serves as a vital guide to the evolving energy landscape.
The 2026 Brent Market Snapshot: Navigating a Market in Overdrive
To understand Brent’s current momentum, let’s review the core data points driving the market.
Historic Inventory Draws Accelerate Prices
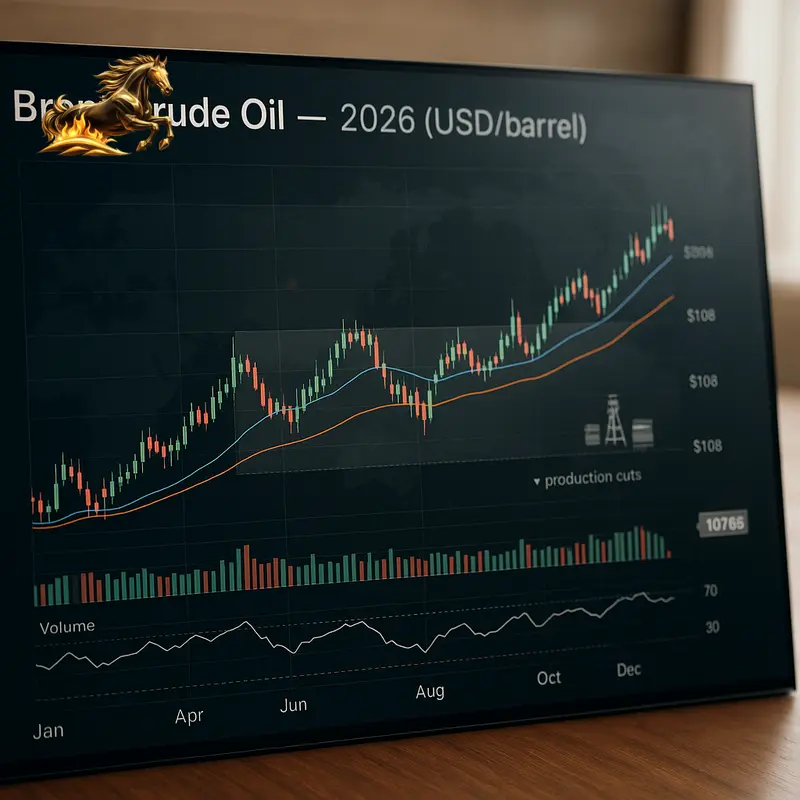
The recent surge is anchored by an unprecedented drop in global oil inventories. The International Energy Agency (IEA) reported a striking 4 million barrels per day drawdown during March and April 2026. This tightening between supply and demand has intensified scarcity, pushing Brent prices to intraday highs of $108 in mid-May and generating an impressive 11.5% monthly gain fueled by strong buyer interest. Although prices have now entered a consolidation zone near $107.60, the narrow trading range reflects a market catching its breath after a significant rally.
Geopolitical Tensions Elevate Risk Premium
Geopolitical risks remain a potent influence on Brent’s price path. Rising unrest in the Middle East—a key oil exporting region—has fueled fears of supply disruptions. This uncertainty has injected a risk premium into the market, visible in Brent’s swift 7.5% climb over three sessions. The chart vividly captures traders’ heightened sensitivity to geopolitical headlines and their impact on prices.
Saudi Arabia’s Production Cuts Bolster Price Support
Saudi Arabia’s decision to scale back oil production to levels unseen since 1990 is another critical factor. As OPEC’s leading power, Saudi Arabia’s disciplined output control has limited market flexibility, amplifying the scarcity picture confirmed by inventory declines. This move has contributed to Brent’s strong upward trajectory from recent lows near $105.69.
Bottom Line: These fundamental and geopolitical drivers collaborate to create a market environment primed for price strength, which the Brent oil stock chart clearly reflects.
Decoding the Chart: Essential Elements for 2026 Analysis
To truly understand the 2026 Brent oil chart, we must go beyond prices to examine key technical and volume indicators.
Price Action: The Core Narrative
- Trading Range: After breaking out, Brent is consolidating between $106 and $108, signaling a pause as participants assess the recent gains.
- Volatility: Sharp, candlestick-like surges on short-term timeframes highlight sensitivity to breaking news and geopolitical shifts, underscoring the need for real-time data in trading decisions.
- Historical Context: Despite recent rallies, Brent remains well below the 2008 peak of $147.50, reminding investors that higher prices remain possible if supply challenges worsen.
Volume Confirms Market Commitment
Trading volume—representing futures contracts exchanged—supports the strength behind price moves. The surge near $108 was accompanied by elevated volume, indicating broad market participation and endorsing the price breakout’s credibility.
Key Technical Indicators
- Moving Averages (50-day, 200-day): Brent’s sustained position above these averages signals a bullish trend and offers dynamic support during pullbacks.
- Relative Strength Index (RSI): The RSI approaching overbought territory (>70) hints at potential short-term retracements, aligning with the current tight trading range.
- Support and Resistance Levels: Psychological price points at $100, $105, and now $110 form critical battlegrounds, with $105 recently confirmed as robust support.
Insight: Balanced interpretation of price trends with supporting technical signals is crucial for understanding Brent’s chart movements.
The Macro Backdrop: Supply, Demand, and Strategy in 2026
Ultimately, price charts reflect broader economic realities.
Supply Constraints Tighten the Market
- OPEC+ Output Discipline: Saudi Arabia and Russia’s commitment to restraining production removes excess supply from the market.
- Reduced Spare Capacity: Years of cautious investment, influenced by the energy transition and capital discipline, have eroded buffer stock, limiting shock absorption.
- Geopolitical Risks: Conflicts and shifting alliances add transport and sanction-related hurdles, intensifying supply constraints.
Demand Remains Resilient
- Robust Global Growth: Emerging market expansion—especially in Asia—fuels steady oil consumption.
- Energy Transition Impact: Despite growth in renewables, oil remains indispensable for transportation and petrochemical use, keeping demand relatively intact.
OPEC’s Price-Support Strategy
OPEC’s 2026 approach aims to maintain price floors by restricting output, stabilizing member revenues and providing a strong baseline for prices. This strategic restraint means dips near key supports may offer attractive entry points aligned with structural tightening.
Summary: Grasping these macro drivers clarifies Brent’s sustained strength and helps shape realistic market expectations.
The Technical Turning Point: Is the Correction Ending?
Advanced chart techniques suggest 2026 could mark a decisive shift for Brent prices.
Elliott Wave Insights: Closing a Multi-Year Correction
- Technical analysts applying Elliott Wave Theory see Brent’s recent price action as the conclusion of a complex ABC correction begun in 2022.
- The correction phase seems near its end.
- The current rally may be the start of a new upward wave (Wave C), with potential for significant gains over the next 1-2 years.
- While short-term dips remain possible, the overall backdrop strongly favors a bullish breakout.
Price Outlook: Technical Meets Fundamentals
- Near-Term: Analysts project prices around $103.40 by Q2 2026’s end, indicating possible consolidation.
- Medium-Term: Twelve-month forecasts hover near $116.69, reflecting an optimistic trajectory consistent with wave theory.
Takeaway: Merging technical analysis with fundamental factors suggests 2026 could herald renewed Brent price strength.
Strategic Insights for Investors and Traders
Thriving in the Brent market requires tailored strategies amid this dynamic environment.
For Active Traders
- Trade the Range: Exploit moves between $105-$106 support and $108-$110 resistance zones.
- Validate Breakouts: Confirm price moves with volume spikes to filter false signals.
- Manage Risk: Use tight stop-loss orders to safeguard capital amid headline-driven swings.
For Long-Term Investors
- Buy the Dips: Treat pullbacks as opportunities to accumulate, backed by strong supply/demand fundamentals.
- Diversify Exposure: Combine crude futures with positions in integrated oil firms, oilfield services, and selected renewables.
- Stay Updated: Track OPEC+ decisions, IEA reports, and macroeconomic indicators to capture key market cues.
Managing Volatility and Risks
- Geopolitical Risks: Remain the foremost source of price shocks—prepare contingency strategies.
- Demand Concerns: Monitor for signs of global slowdown impacting consumption.
- Currency Effects: Watch the US Dollar Index (DXY), as a strong dollar tends to pressure oil prices.
Strategic Summary: Discipline, vigilance, and diversified tactics are essential for success in this fast-evolving market.
Conclusion: Mastering the Brent Oil Stock Chart in 2026 and Beyond
The Brent oil stock chart in mid-2026 reflects a market at a critical crossroads: geopolitical tensions, shrinking supplies, and emerging technical signs pointing toward a new bullish phase. Saudi Arabia’s historic production cuts, record inventory declines, and Elliott Wave patterns all support continued price strength—even as volatility persists.
- Fundamentals Provide Strong Support: Historic inventory pulls and OPEC+ output discipline lay a solid foundation.
- Geopolitical Events Shape Volatility: Effective risk management is crucial amid regional uncertainties.
- Technical Patterns Signal Potential Bull Run: The multi-year correction phase appears close to completion.
- Patience and Smart Strategy Win: Volatility creates opportunity for prepared, disciplined traders and investors.
Looking forward, setting price alerts, closely analyzing fundamental data, and aligning risk appetite with market conditions will empower participants not just to react, but anticipate moves. The Brent oil stock chart is more than a price tracker—it’s a window into the complex global forces shaping the future of energy.
Frequently Asked Questions (FAQ)
- Q1: Why did Brent oil prices surge above $106 in May 2026?
- The surge was driven by an unprecedented 4 million barrels per day global inventory drawdown reported by the IEA, combined with escalating Middle East geopolitical tensions boosting the market’s risk premium.
- Q2: What does Saudi Arabia’s production at 1990 lows imply?
- It signals Saudi Arabia’s strategic commitment to sustaining prices through deliberate output cuts, tightening supply and supporting the market structure.
- Q3: What price levels do analysts expect by end-2026 and beyond?
- Consensus forecasts Brent near $103.40 by Q2’s close and around $116.69 over the following year, suggesting continued upward momentum.
- Q4: What does “end of a two-year correction” mean technically?
- It refers to completing a complex Elliott Wave corrective pattern started in 2022, marking possible entry into a new bullish phase.
- Q5: How should investors approach Brent trading amid volatility?
- Employ disciplined risk management; active traders should focus on defined ranges and volume for confirmations, while long-term investors can buy dips, always monitoring geopolitical developments and macroeconomic trends.
Understanding the Brent oil stock chart in 2026 means appreciating the nuanced interplay of supply-demand fundamentals, geopolitical risks, and evolving technical signals. Armed with these insights, traders and investors can navigate volatility with confidence and foresight.