
body {
font-family: “Helvetica Neue”, Helvetica, Arial, sans-serif;
color: #222;
line-height: 1.65;
padding: 1.5rem 2rem;
max-width: 900px;
margin: auto;
background: #fff;
}
h1.chi› {
font-size: 2.8rem;
font-weight: 700;
color: #003366;
margin-bottom: 1rem;
border-bottom: 3px solid #007acc;
padding-bottom: 0.3rem;
}
h2 {
color: #004080;
border-bottom: 1.5px solid #aaddff;
padding-bottom: 0.25rem;
margin-top: 2.5rem;
margin-bottom: 1rem;
font-weight: 600;
}
h3 {
color: #0059b3;
margin-top: 1.8rem;
margin-bottom: 0.75rem;
font-weight: 600;
}
p {
margin: 0.75rem 0 1.25rem 0;
font-size: 1.05rem;
color: #333;
}
ul {
margin: 0.5rem 0 1.25rem 1.35rem;
}
ul li {
margin-bottom: 0.5rem;
font-size: 1rem;
color: #444;
}
img {
max-width: 100%;
display: block;
margin: 1rem 0 0.5rem 0;
border-radius: 6px;
box-shadow: 0 3px 8px rgba(0,0,0,0.12);
}
em {
color: #666;
font-size: 0.9rem;
display: block;
margin-bottom: 1.6rem;
font-style: italic;
}
hr {
border: none;
border-top: 1.5px solid #eee;
margin: 3rem 0 3rem 0;
}
a {
color: #007acc;
text-decoration: none;
}
a:hover {
text-decoration: underline;
}
strong {
color: #003366;
}
blockquote {
border-left: 4px solid #aaddff;
margin-left: 0;
margin-right: 0;
padding-left: 1rem;
color: #555;
font-style: italic;
background: #f7fbff;
border-radius: 4px;
margin-top: 1rem;
margin-bottom: 1.5rem;
}
Understanding the WTI Crude Oil Price Chart: Trends
As we move through 2026, decoding West Texas Intermediate (WTI) crude oil price trends is more important than ever. WTI crude oil prices impact everything—from gas pump costs to the stability of global markets—making WTI price charts an essential tool for investors, policymakers, and energy analysts. This guide breaks down WTI crude oil basics, highlights crucial historical trends, explores key factors influencing prices, and offers a fresh outlook on what 2026 might bring.
What is WTI Crude Oil?
Definition and Importance
West Texas Intermediate (WTI) is a benchmark crude oil type, sourced primarily from the U.S. Known as a light sweet crude, WTI boasts low density and sulfur content, which means it’s easier and cheaper to refine into gasoline, diesel, and other fuels. This makes WTI a cornerstone of the energy sector.
Beyond its physical traits, WTI serves as a major pricing benchmark—not just for American crude but for global oil transactions. Monitoring WTI price movements offers insight into the overall health of the oil market and its ripple effects across the world economy.
WTI Prices’ Role in the Global Economy
Oil prices directly influence global economic activity. When WTI prices rise, business costs increase, impacting transportation and manufacturing expenses. Lower oil prices tend to encourage consumer spending but can squeeze earnings for oil producers and exporting countries. Keeping an eye on WTI prices helps businesses and governments anticipate economic shifts and adjust their strategies accordingly.
Reading the WTI Crude Oil Price Chart
WTI price charts visually track price changes over specific intervals—daily, weekly, monthly, or yearly. These charts help investors and analysts spot trends, volatility, support and resistance levels, and project future price movements. Understanding these patterns is key to making smarter trading decisions and economic plans.
Historical Price Trends of WTI Crude Oil
Key Historical Insights
WTI prices are highly responsive to global economic and geopolitical events:
- Post-2008 Financial Crisis: Prices plunged amid a sharp drop in global demand, triggering intense volatility.
- 2014 Price Collapse: After reaching over $100 per barrel, WTI prices tumbled below $30 by early 2016 due to oversupply and weakening demand.
- 2020 COVID-19 Pandemic: A historic slump forced WTI prices briefly into negative territory in April 2020, a first driven by collapsing demand and storage constraints.
Recognizing these historic shifts helps put today’s market behavior into perspective.
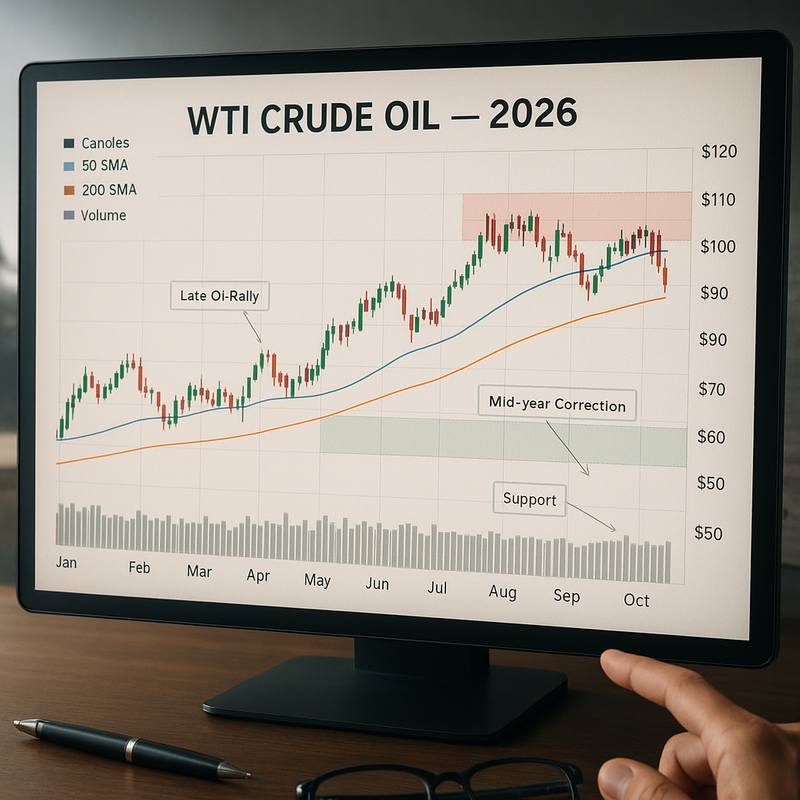
Current WTI Price Chart in 2026
In early 2026, WTI crude oil prices are fluctuating amid geopolitical developments, supply chain challenges, and a gradual global economic recovery post-pandemic.
Source: Trading Economics
Crucial Chart Patterns and Indicators
When analyzing the latest price chart, watch for:
- Support and Resistance Levels: These critical price points reveal where buying or selling pressures typically slow or reverse trends.
- Moving Averages: The 50-day and 200-day averages help uncover short-term momentum versus long-term trends, guiding entry and exit strategies.
- Trading Volume: Volume spikes alongside price shifts indicate strong market momentum, signaling potential sustained moves.
Factors Driving WTI Crude Oil Prices
Several intertwined factors shape WTI price movements:
1. Supply and Demand Balance
- OPEC Production Policies: OPEC’s production cuts tend to tighten supply, driving prices up, while increased output often lowers prices.
- U.S. Shale Oil Growth: Innovations boosting U.S. shale production have altered global supply dynamics significantly.
2. Geopolitical Risks
Political instability in oil-rich regions, especially the Middle East, disrupts supply routes and fuels market volatility due to fears of shortages or actual supply interruptions.
3. Global Economic Health
Strong economic growth in major consumers like China and the U.S. ramps up oil demand and prices; economic slowdowns dampen consumption and ease price pressures.
4. Currency Movements
Since oil trades predominantly in U.S. dollars, a stronger dollar makes oil costlier for other currency holders, reducing demand and potentially pressuring prices downward.
5. Tech and Environmental Shifts
Innovations in drilling and the growing push toward renewable energy and climate policies influence future supply levels and long-term demand outlooks.
Forecasting WTI Prices in 2026
Expert Predictions
Most analysts remain cautiously optimistic for 2026, noting:
- Ongoing Demand Recovery: Increased travel and industrial activity support stable or rising oil consumption.
- Energy Transition Complexity: While renewables gain momentum, oil demand remains significant due to existing infrastructure and economic factors.
Quantitative Approaches
Forecasting models rely on:
- Historical Time Series Analysis: Identifying recurring trends and seasonal price cycles.
- Economic Indicators: Tracking GDP growth, industrial output, and employment data in key economies to predict demand-driven price movements.
Expect Market Volatility
Despite forecasts, WTI prices are vulnerable to abrupt swings from geopolitical upheavals, policy changes, or unforeseen supply disruptions. Preparedness for both short-term fluctuations and long-term trends is essential.
Staying Informed on WTI Prices
Keeping updated through trusted sources is crucial for anyone affected by oil price volatility. Regularly consult:
- Financial and commodity news outlets
- Market research and analysis reports
- Industry forums and conferences
- Brokerage insights and trading alerts
Conclusion
The WTI crude oil price chart is more than just a graph—it reveals the complex interplay of factors shaping one of the world’s vital commodities. In 2026, amid evolving geopolitical tensions, economic recoveries, and the energy transition, tracking WTI price trends is key to informed decision-making.
Key Takeaways
- WTI prices reflect supply-demand dynamics, geopolitics, economic trends, currency shifts, and technological change.
- Historical price patterns provide essential context for understanding current movements and anticipating future shifts.
- While renewable energy growth may alter demand long-term, short- and medium-term WTI price volatility will remain.
Moving Forward
For investors, businesses, and policymakers alike, staying sharp on WTI price charts and market data supports sound strategies in a rapidly changing energy environment. Rely on comprehensive, reputable sources to stay agile and informed.
Further Resources:
– Oilprice.com – Real-Time Oil Prices
– Trading Economics – Crude Oil Prices
Understanding the WTI crude oil price chart empowers you to navigate market signals skillfully and make smart, timely decisions in an evolving global energy landscape.