

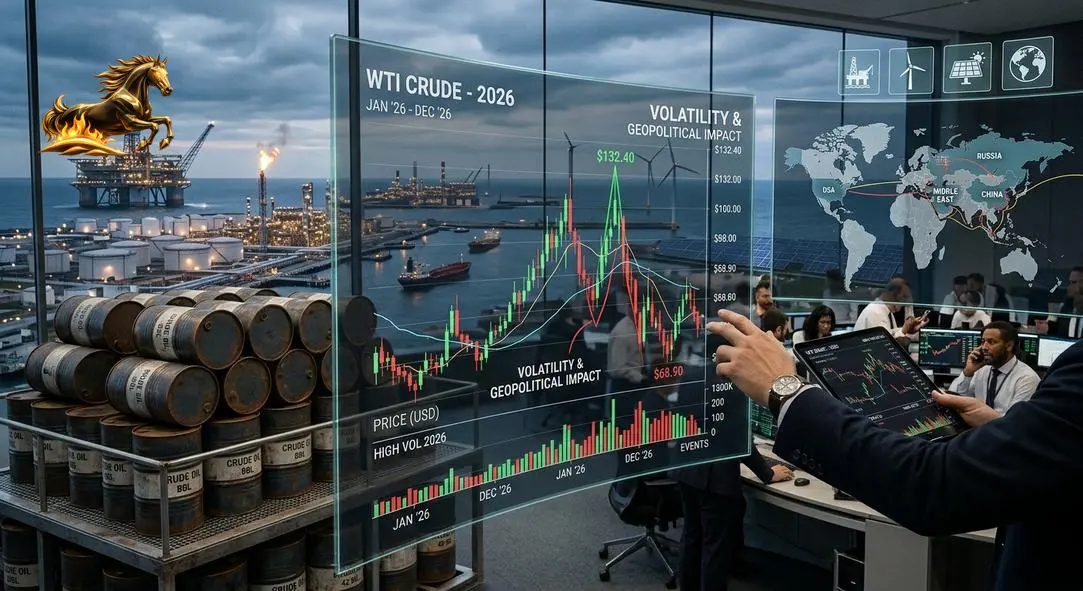
Petroleum Price Chart: Decoding 2026’s Volatile Market and What Lies Ahead
The 2026 petroleum price chart is more than just a graph—it’s the heartbeat of the global economy. As we move into the year’s final quarter, this chart paints a picture of remarkable volatility, historic price gaps, and a market balancing geopolitical tensions, the urgent energy transition, and ongoing demand. For businesses, investors, and consumers alike, mastering the petroleum price chart is key to navigating today’s complex energy landscape.
In late October 2026, U.S. Energy Information Administration (EIA) data showed West Texas Intermediate (WTI) crude oil surging past $100 per barrel, closing at $105.25 on October 26th. Globally recognized Brent crude commanded an even higher price of $128.12. This climb isn’t temporary—Trading Economics reports a 13.78% WTI increase in just one month and a staggering 68.15% rise year-over-year. Meanwhile, the Brent-WTI spread expanded sharply, reflecting intricate regional supply issues and shifting global trade patterns. This blog dives deep into the 2026 petroleum price chart, unraveling the forces behind these moves, their wider impact, and strategies for riding out this turbulent market.
Understanding Petroleum Price Charts: More Than Just Numbers
A petroleum price chart visualizes the delicate dance of supply and demand, geopolitical shifts, and economic factors. It transforms vast global transactions, policy changes, and unexpected events into a clear narrative—a vital tool whether you’re a corporate CFO managing fuel budgets or a consumer tracking energy costs.
The Anatomy of Petroleum Price Charts
Key elements include:
- Timeframes: From intraday price swings to decades-long trends, these charts reveal both immediate market sentiment and structural shifts. The recent 68% annual jump in WTI highlights significant long-term changes amid daily price moves of 0.5% to 1.4%.
- Benchmarks: Brent Crude and West Texas Intermediate (WTI) are the global price reference points. Brent, sourced from the North Sea, drives most waterborne crude trades worldwide, influencing two-thirds of global consumption. WTI, primarily a North American benchmark, reflects U.S. supply dynamics. The 2026 $20+ Brent premium over WTI highlights logistics constraints, export limits, and crude quality variances.
- Chart Types: Line charts track closing prices over time, while candlestick charts provide a detailed snapshot of opening, closing, high, and low prices—essential for interpreting the month-to-month volatility gripping the market.
Why Petroleum Price Charts Matter
Petroleum price charts are critical across sectors:
- Strategic Business Planning: Manufacturers, airlines, and logistics firms rely on past and projected prices to hedge fuel costs, set pricing, and manage risk. The 2026 price surge demanded swift budget and contract adjustments.
- Investment Decisions: Traders and investors analyze chart patterns, support and resistance levels, and momentum to time their moves. The clear upward trend through 2025 and 2026 offered opportunities and risks alike.
- Economic Forecasting: Policymakers and central banks monitor oil prices to forecast inflation, adjust policies, and plan budgets, with elevated prices strongly influencing global inflation.
- Geopolitical Insight: Sudden price spikes often precede geopolitical events like conflicts or sanctions, serving as a global stability barometer.
Bottom line: Mastering the petroleum price chart empowers stakeholders to anticipate market shifts and make smarter, strategic decisions.
2026 Petroleum Pricing Trends: A Market on Fire
The defining feature of 2026’s petroleum prices is a powerful surge marked by sharp volatility—more like a series of rapid-fire spikes than a steady climb.
The Jaw-Dropping Year-on-Year Rally
As of late October 2026, Trading Economics reported WTI at $101.70 per barrel—up a staggering 68.15% year-over-year. Brent outpaced with a 79.82% rise to $115.66. This is more than recovery from past shocks; it signals a fundamental market reset shaped by ongoing complexities.
The Great Divide: Brent vs. WTI Spread Widens
The Brent-WTI price gap exploded beyond $20 per barrel, defying typical narrow spreads driven mainly by transportation costs. Why?
- Regional Supply Constraints: Brent is highly sensitive to disruptions in global maritime supply chains, especially from OPEC+ producers in the Middle East and Africa.
- U.S. Infrastructure Limits: Despite strong shale output, pipeline bottlenecks and export terminal limits sometimes isolate WTI supply, keeping its price suppressed.
- Quality and Refining Demand: Refineries optimized for Brent’s properties sustain its premium, especially amid high diesel and specialized fuel demand.
Intraday Volatility: Market on Edge
Daily price swings between 0.5% and 1.4% underline a restless market driven by:
- Algorithmic trading reacting instantly to news
- Speculative moves based on technical trends
- Ongoing geopolitical headlines shaping sentiment
What’s Behind 2026’s Price Surge?
Several intertwined forces have caused this rapid price ascent.
1. Geopolitical Tensions and Supply Disruptions
- Conflicts in key oil-producing regions inject a risk premium into prices.
- Sanctions reshape supply routes, often lengthening and complicating logistics.
- Strategic reserves are wielded strategically by governments aiming to stabilize or influence markets.
2. OPEC+’s Tight Grip
- Controlled production keeps supply tight, supporting price floors despite fluctuating demand.
- Shrinking spare capacity tightens the safety net, elevating market anxiety and prices.
3. Demand’s Resilience Amid Transition
- Emerging Asian economies keep fossil fuel demand high in aviation and chemicals.
- EV adoption struggles with supply chains and infrastructure, slowing oil demand decline.
- Petrochemical and industrial uses anchor steady consumption.
4. Environmental Policies as a Supply Constraint
- Tighter rules and shifting investor sentiment restrict capital flow to fossil fuel projects.
- Underinvestment in refining capacity limits fuel supply, indirectly pushing crude prices higher.
Regional Perspectives on 2026’s Market
- United States: Benefitting from higher revenues, but balancing inflation and political pressures.
- Europe: Faces affordability challenges and conflicts with energy security and climate goals.
- Asia-Pacific: Navigates economic consequences using strategic reserves and long-term contracts.
- OPEC+ Nations: Gains fiscal strength but risks accelerated energy transition threatening their market share.
Price Outlook: What to Expect Moving Forward
While price predictions are uncertain, three scenarios stand out:
- “Higher for Longer” (Bull Case): Geopolitical risks plus tight supply keep Brent between $100 and $130, with spikes to $150 during crises, fueling persistent inflation.
- “Demand Destruction & Recession” (Bear Case): Economic downturn and rapid electrification drop prices to $70–$90, easing costs but straining producers.
- “Volatile Transition” (Most Likely): Prices swing between $80 and $120 with sharp quarterly moves, calling for agile risk management.
Strategies to Navigate the 2026 Petroleum Market
Businesses should:
- Use advanced hedging tools to manage price risks.
- Improve operational efficiency to reduce fuel dependence.
- Diversify energy portfolios toward renewables and electrification.
Investors should:
- Track macro and geopolitical drivers along with technical indicators.
- Focus on integrated energy players with strong risk controls.
- Explore emerging sectors like carbon capture and renewable tech.
Policymakers should:
- Communicate energy trade-offs clearly to the public.
- Leverage strategic reserves effectively for market stability.
- Promote flexibility, innovation, and diverse energy sources to bolster resilience.
Conclusion: Using the Petroleum Price Chart as Your Strategic Compass
The 2026 petroleum price chart tells the story of a world in transition—caught between traditional energy reliance, geopolitical upheavals, and a rising tide of sustainability. Its volatility and shifting spreads underscore the complexities of today’s global energy system.
Key takeaways:
- Volatility is the new normal.
- Multiple factors drive prices; understanding these is critical.
- Proactive, informed strategies turn uncertainty into opportunity.
By mastering this essential market indicator, businesses, investors, and policymakers can make smarter, more resilient decisions in an unpredictable energy future.
Frequently Asked Questions (FAQ)
Q1: Why is the Brent-WTI price gap so large in 2026?
The unusually wide Brent-WTI spread reflects Brent’s exposure to global maritime supply risks and geopolitical tensions, plus U.S. infrastructure bottlenecks limiting WTI price gains.
Q2: Will these high oil prices last through the decade?
Many experts predict a “higher for longer” trend driven by tight supply and risks, but significant price corrections remain possible if demand weakens or new supplies emerge.
Q3: How do rising oil prices affect consumers?
Higher crude prices increase gasoline, diesel, and heating fuel costs, which raise transportation and manufacturing expenses, ultimately leading to higher prices for consumers.
Q4: Why does oil demand remain strong despite renewables and EV growth?
The energy transition is gradual—most vehicles still run on fossil fuels, and sectors like petrochemicals and aviation heavily rely on oil. Emerging markets also sustain solid demand.
Q5: What’s the best way to track oil prices and trends?
Reliable sources include the U.S. Energy Information Administration (EIA) for official data, Trading Economics for detailed charts and history, and OilPrice.com for real-time updates and analysis.
Understanding and interpreting the petroleum price chart is your key to mastering the complex and ever-changing global energy market. With the right knowledge, your business, investments, or policies can thrive—even amidst uncertainty.
