

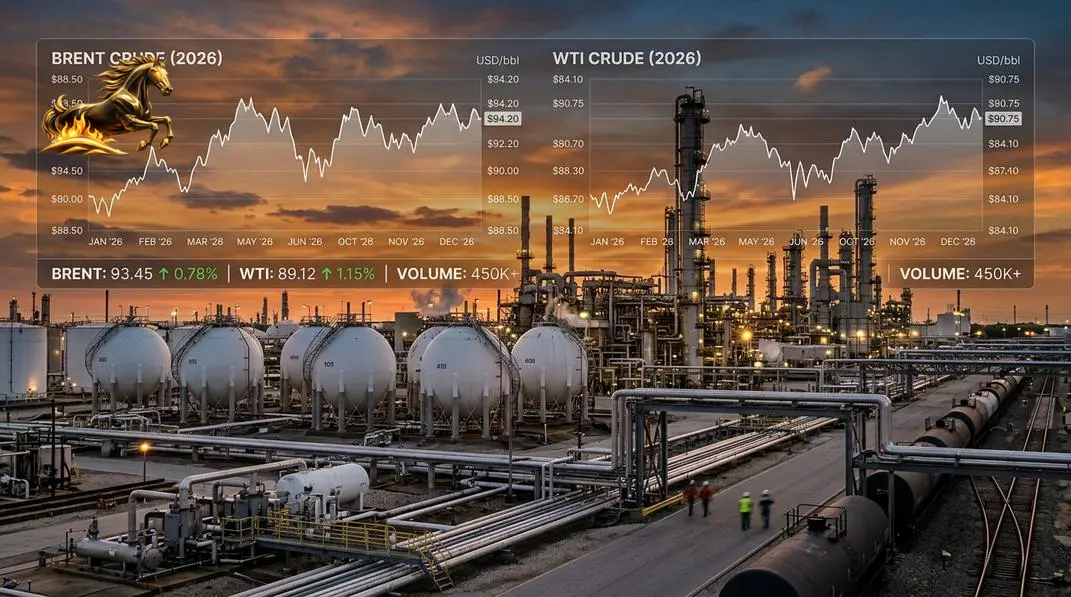
The 2026 Brent vs. WTI Price Chart: Your Ultimate Guide to Oil Market Dynamics and Trading Opportunities
Picture two numbers setting the pulse of the global economy. In early October 2026, West Texas Intermediate (WTI) crude oil traded near $99 per barrel, while Brent crude steadied above $110. This $11 price gap—the Brent-WTI spread—is much more than a statistic. It mirrors deep-rooted forces like geopolitics, supply chains, and market demand. The 2026 Brent vs. WTI price chart is an essential compass for navigating the trillion-dollar energy market. With the heightened volatility this year, understanding what drives this chart is key—not only for scholars but also for traders, investors, and policymakers seeking informed strategies. This comprehensive guide unpacks these drivers, examines the current market terrain, and offers a peek into the future.
What’s Brent and WTI? Clearing the Fog on Global Oil Benchmarks
Before diving into price trends, let’s clarify the players—Brent and WTI—two pillars underpinning global oil pricing and millions of barrels traded daily.
Brent Crude: The Global Benchmark
Brent Crude is sourced from the North Sea oilfields between the UK and Norway. Known as “light sweet” crude, its low density and sulfur content make it easier and cheaper to refine. Crucially, Brent sets the price for about two-thirds of internationally traded oil. Because it’s tied to seaborne trade, Brent prices are especially sensitive to geopolitical upheavals in Europe, Africa, and the Middle East—regions often brimming with supply uncertainties.
West Texas Intermediate: America’s Barometer
WTI is also light sweet crude, derived from Texas, Louisiana, and North Dakota oilfields. Centered on pricing at Cushing, Oklahoma, WTI reflects U.S. domestic market forces such as shale production, inventory levels, Gulf Coast refinery output, and broader economic signals. Once commanding a premium, WTI’s pricing dynamic shifted with the shale boom and infrastructure advancements, shaping the current Brent-WTI spread.
Why Two Benchmarks?
The dual benchmarks highlight oil’s physical and logistical realities. Brent represents global waterborne trade, while WTI captures a traditionally pipeline-bound, U.S.-centric market. Although U.S. crude exports have surged since 2015, geography, infrastructure, and participant behavior keep Brent and WTI influenced by distinct forces. The spread between them reveals these regional nuances playing out in pricing.
Bottom line: Knowing the origin and role of these benchmarks is vital for decoding the 2026 price chart and oil market structure.
The 2026 Price Chart: High Volatility Meets Elevated Prices
By October 2026, the Brent and WTI charts reveal a market marked by steady strength and sharp fluctuations triggered by key developments.
- Brent Crude hovers near $110 per barrel—a striking 74% jump year-over-year—reflecting tight global supply chains and mounting geopolitical tensions.
- West Texas Intermediate climbs close behind at $99, propelled by robust domestic fundamentals and global influences.
In this climate, prices react swiftly to news. Mid-October surges followed Iran-linked attacks near the Strait of Hormuz, a critical oil chokepoint; dips occurred after U.S. eased shipping restrictions. This real-time price sensitivity highlights the chart’s role as a snapshot of geopolitical risk and supply expectations.
Key takeaway: The 2026 price chart paints a vivid picture of markets balancing tight fundamentals against persistent geopolitical uncertainty—which means volatility is here to stay.
What’s Driving the Brent/WTI Price Spread in 2026?
The price chart’s ups and downs reflect several intertwined forces. Let’s break them down.
1. Geopolitical Hotspots and Supply Security
- Middle East & Strait of Hormuz: Disruptions here trigger immediate Brent price spikes, given the region’s critical role in global oil transit.
- Russia & Sanctions: Ongoing sanctions and shifts in Russian exports impact supply flows linked to Brent, underpinning price premiums.
- OPEC+ Moves: Production cuts or unexpected supply interruptions from OPEC+ significantly tighten markets and sway both Brent and WTI.
2. Supply and Demand Fundamentals
- Global Demand: Strong consumption in the U.S., China, India, and Europe pushes prices upward despite macroeconomic headwinds.
- Non-OPEC+ Supply: The U.S. shale sector remains the crucial marginal supplier but faces limits from capital discipline and higher production costs.
- Inventories: Persistently low global stockpiles tighten markets, making prices vulnerable to shocks.
3. Dollar Strength and Financial Dynamics
- A strong U.S. dollar can cool demand as oil gets costlier for those using other currencies, holding prices down.
- Speculative trading injects short-term momentum, often triggering corrections when markets stretch too far.
4. Logistics, Infrastructure & the Brent-WTI Spread
- Export Capacity: When U.S. export infrastructure lags production growth, WTI discounts widen against Brent, motivating more crude exports.
- Regional Imbalances: Refineries offline or weather disruptions shift supply-demand locally, rattling the spread temporarily.
In brief: Price and spread movements mirror a complex dance of geopolitical events, supply-demand fundamentals, financial tides, and logistical hurdles.
Technical Insights: Digging Deeper into Price Patterns
For savvy traders, Brent and WTI charts provide critical clues beyond headlines.
- Psychological Price Levels: Round numbers (WTI near $100, Brent above $110) act as key support/resistance zones, influencing breakout or pullback potential.
- Momentum & Trends: Bullish moving averages confirm the current uptrend, while indicators like RSI highlight possible short-term overbought conditions.
- Spread Tracking: Watching the Brent-WTI differential signals evolving regional tightness and export dynamics, sharpening market timing.
Bottom line: Blending fundamental news with technical analysis boosts trading accuracy and market understanding.
Why the 2026 Oil Price Landscape Matters
Global Economy
High oil prices add to inflationary pressures, straining central banks and squeezing consumer budgets worldwide. Exporting nations reap revenue benefits, while importers—especially developing countries—feel financial stress. Meanwhile, surging prices accelerate investments in energy diversification and efficiency.
Investors & Traders
Volatile markets present lucrative chances in oil futures, options, and ETFs. Mastering the Brent-WTI spread is key for spread traders. Upstream producers enjoy stronger cash flows, though refining margins face mixed fortunes.
Energy Transition
While high oil prices improve renewable energy economics, they also boost fossil fuel profitability—creating a tricky balance that shapes decarbonization speed.
Bottom line: Brent-WTI price behavior influences economic policy, investment choices, and the very pace of the global energy shift.
Looking Ahead: What’s Next Beyond 2026?
- Shrinking Spare Capacity: With fewer buffers, prices become highly sensitive to supply shocks.
- Underinvestment: Years of restrained investment in mega oil projects tighten supply outlooks.
- Demand Uncertainty: Renewables grow, yet petrochemicals and emerging markets sustain oil demand for now.
- Policy Evolutions: Energy security and climate policies create risks and opportunities shaping futures.
Summary: Complex interplay among supply constraints, evolving demand, and policy trajectories will define Brent-WTI dynamics for years ahead.
Conclusion: Mastering the Brent vs. WTI Chart for Confident Navigation
The 2026 Brent vs. WTI price chart tells a story far beyond numbers—unveiling real-time insights into global supply chains, geopolitical tensions, and economic health. Grasping these market signals empowers smarter decisions amid ongoing volatility.
What You Should Remember
- Brent and WTI trade robustly above $110 and $99, driven by tight supply and geopolitical risks.
- The Brent-WTI spread remains a critical gauge of regional dynamics and logistical challenges.
- Geopolitics, OPEC+ policies, and tempered U.S. shale growth dominate pricing.
- Elevated prices impact inflation, energy strategies, and investment flows.
- Volatility is the new norm due to reduced spare capacity and market tightness.
Action Steps
- Traders: Track geopolitical headlines with technical chart signals; use the spread as a compass for shifting supply-demand.
- Investors: Build diversified energy portfolios balancing traditional oil plays and transition leaders.
- Business Leaders: Factor high oil prices into planning, hedge risks wisely, and invest in efficiency.
- Observers: Stay updated through trusted data and news to navigate evolving market dynamics.
Master the rich insights woven into the Brent and WTI charts to confidently steer through the complexity of the global energy economy.
FAQs: Quick Answers to Common Brent vs. WTI Questions
Q1: Why does Brent usually trade at a premium to WTI?
Brent’s reliance on seaborne shipment exposes it to geopolitical risks and transit costs unlike landlocked WTI, justifying its premium tied to global market tensions.
Q2: What does a widening Brent-WTI spread indicate?
A larger spread points to tighter supply or stronger demand in Atlantic Basin markets relative to U.S. domestic conditions, often driven by logistics or regional disruptions.
Q3: How do U.S. oil exports influence WTI prices and the spread?
Robust exports boost WTI prices and narrow the spread by linking U.S. crude to the global market; export constraints or weak demand widen that gap.
Q4: Which benchmark impacts U.S. gasoline prices more?
WTI more directly affects U.S. gasoline prices due to domestic refining, though Brent’s global presence indirectly influences fuel costs.
Q5: Are Brent and WTI still relevant amid the energy transition?
Absolutely. Oil remains vital economically, and these benchmarks continue to steer pricing and market dynamics through 2026 and beyond.
Understanding the Brent versus WTI price chart is essential for anyone involved in today’s energy markets. It reveals the underlying currents shaping oil prices, global economic trends, and geopolitical landscapes alike.
