
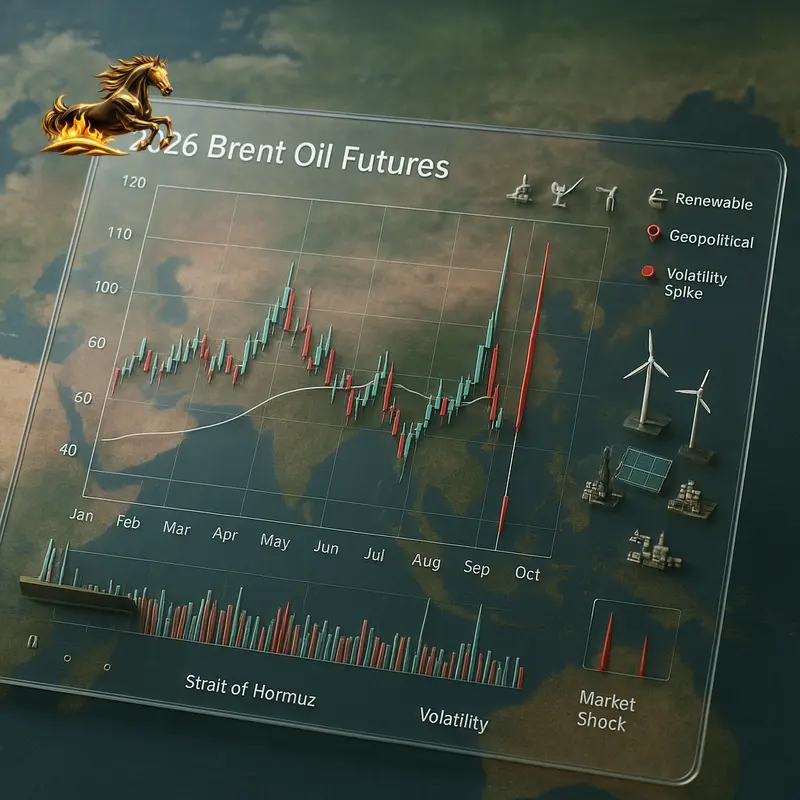
The 2026 Brent Oil Futures Chart: Your Ultimate Guide to Navigating a Volatile Market
In today’s fast-changing global finance scene, the Brent oil futures chart is much more than just a price graph—it’s a vital barometer of economic health, geopolitical tensions, and energy market stability. As we move through 2026, this key benchmark captures the complex dance between supply constraints, international conflicts, and shifting demand amid a world transitioning toward new energy paradigms. Recent price swings, fueled by geopolitical risks and supply fluctuations, highlight a market rife with volatility. Mastering how to read the Brent oil futures chart is essential for investors, traders, and business leaders who want to confidently navigate this turbulent terrain. This guide breaks down the chart’s crucial elements, decodes the forces driving 2026 prices, and equips you with the strategies you need to engage effectively with this critical financial tool.
Understanding the Brent Oil Futures Chart in 2026
What Are Brent Oil Futures?
Brent oil futures are standardized contracts traded mainly on the Intercontinental Exchange (ICE), locking in the purchase or sale of a fixed amount of Brent crude oil at a set price on a future date. For companies like airlines and manufacturers, these contracts act as effective hedges, protecting against unpredictable fuel costs. For traders and investors, Brent futures create opportunities to capitalize on anticipated price shifts.
Every tick on the Brent futures chart reflects collective expectations about future supply, demand, and geopolitical pressures surrounding one of the world’s most vital commodities.
Why Brent Crude Is the Global Benchmark
Originating from the North Sea, Brent crude is classified as “light” and “sweet,” meaning it has lower density and sulfur content—qualities that make refining easier and more cost-efficient. Brent’s transparent pricing and widespread recognition have established it as the global oil benchmark, with over two-thirds of international crude contracts referencing Brent prices.
Therefore, the Brent futures chart serves as a bellwether not only for commodity prices but also for major economic signals such as inflation trends and geopolitical stability.
Decoding 2026 Price Movements: A Market on High Alert
In early 2026, Brent oil prices have shown dramatic volatility—climbing near the mid-$90s, plunging sharply, then bouncing back quickly. This roller-coaster reflects a market increasingly unsettled by supply constraints and geopolitical unrest.
The Driving Force: Geopolitics and the Risk Premium
At the core of Brent futures pricing lies the geopolitical risk premium—the extra cost buyers are willing to pay to offset potential supply disruptions. This premium is especially pronounced following rising tensions at the Strait of Hormuz, a vital oil transit chokepoint responsible for approximately 20% of global consumption:
- U.S. strikes targeting Iranian-backed sites near the Strait have raised fears of supply interruptions.
- Iranian retaliatory drone and missile attacks on U.S. bases in Kuwait have heightened uncertainty, injecting volatility into futures prices.
- Traders monitor evolving political and military developments closely, swiftly pricing in market sentiments about conflict duration and escalation risks.
Underlying Market Fundamentals
Beyond headline shocks, the Brent chart reflects these steady supply and demand realities:
- Supply factors:
- OPEC+ maintains tight production discipline to support prices.
- Global inventories are relatively low compared to historical averages.
- Investment in new oil projects is constrained by the energy transition and cost considerations, limiting supply growth.
- Demand trends:
- Worldwide oil consumption remains robust, especially in emerging markets offsetting declines in developed countries.
- Despite fast-growing renewables, hydrocarbons still dominate energy needs in 2026; price-driven demand reductions have been modest.
This sturdy foundation underpins Brent prices despite episodic shocks.
What Moves Brent Prices? Bullish vs. Bearish Catalysts
Grasping the key drivers behind price swings is critical for anticipating market directions.
Bullish Triggers
- Escalated conflicts in Middle Eastern regions jeopardizing key shipping lanes or infrastructure.
- Unexpected OPEC+ production cuts tightening supply.
- Strong global economic growth, particularly in Asia and North America.
- Sharp drops in global oil inventories.
- Natural disasters disrupting U.S. refining or production capacity.
Bearish Triggers
- Diplomatic breakthroughs easing Middle East tensions.
- Signs of a global economic slowdown reducing oil demand.
- Surges in production from OPEC+ or other producers.
- Coordinated releases from strategic petroleum reserves.
- Elevated interest rates slowing economic growth and bolstering the U.S. dollar.
Key Price Levels to Watch
- Resistance: $97–$98 — A break here could push Brent prices toward the psychological $100 mark.
- Support: $92–$93 — Stability in this zone suggests market resilience.
- Critical Support: $87–$88 — Aligns with major technical trendlines indicating long-term support.
Currently, the Brent market oscillates in a volatile $92–$98 range, driven strongly by news flow and geopolitical developments.
Essential Chart Analysis Tools for 2026 Investors
Successfully navigating the Brent futures chart requires these proven analytical tools:
Must-Know Chart Types
- Candlestick Charts: Show open, high, low, and close prices per period, uncovering buyer/seller momentum and reversal signals.
- Line Charts: Connect closing prices over time, smoothing out intraday noise to reveal broader trends.
- Bar Charts: Similar to candlesticks, useful for tracking range extremes.
Technical Indicators
- Moving Averages (50-day and 200-day): Highlight trend direction and turning points; crossovers like the Golden Cross indicate bullish shifts.
- Relative Strength Index (RSI): Measures momentum, with readings above 70 signaling overbought, below 30 oversold.
- Volume: Confirms the strength of price moves; breakouts on high volume show conviction.
- Bollinger Bands: Define volatility limits, with price moves outside bands indicating potential reversals.
Cutting-Edge Insights
Leveraging AI-driven analytics analyzing satellite data of shipment flows, storage, and market sentiment is revolutionizing price discovery. Stay connected with trusted real-time data from ICE, TradingView, and Investing.com for an edge.
Strategic Approaches to Brent Futures in 2026
1. Hedging: Shielding Against Risk
Fuel-dependent businesses use Brent futures to lock in costs and minimize budget uncertainty amid volatile prices. Given 2026’s ups and downs, hedging remains a smart risk management strategy.
2. Speculative Trading: Profiting from Volatility
Successful traders keep a clear market thesis, apply rigorous risk controls like stop-loss orders, and coordinate multiple timeframes to avoid whipsaws.
3. Portfolio Diversification: Long-Term Opportunity
Energy assets provide inflation hedges and diversify portfolios due to their low correlation with stocks and bonds. ETFs and ETNs tied to Brent futures offer accessible exposure.
Looking Ahead: The Future of Brent Oil Futures
- Energy Transition: Continued climate policies will slow demand growth and redirect capital away from fossil fuels.
- Geopolitical Fragmentation: Regional blocs and alternative payment systems may disrupt traditional oil market flows.
- Data Revolution: Integrating emissions data, EV trends, and political risks will refine price forecasts.
- U.S. Dollar Dynamics: Dollar strength remains a crucial inverse driver of Brent prices.
Conclusion: Master the New Normal in Brent Futures
The 2026 Brent oil futures chart tells a layered story of supply-demand balance, geopolitical risks, and structural energy shifts. Mastery involves blending technical analysis with a deep understanding of market fundamentals and global affairs.
Key Takeaways:
- Geopolitical risks around the Strait of Hormuz dominate short-term price action.
- Solid supply-demand fundamentals support a price floor barring major economic setbacks.
- Volatility is inherent; robust risk management is vital.
- Combine technical tools with real-time market intelligence for better decisions.
- Tailor your approach—whether hedging, trading, or investing—to fit your goals.
Next Steps:
- Track live Brent futures charts on TradingView and Investing.com for up-to-the-minute insights.
- Stay updated with key inventory and economic reports.
- Develop a disciplined trading checklist including thesis, risk levels, and exit strategies.
- Start small or use simulation platforms to build experience.
Understanding 2026 Brent oil futures empowers you to navigate this critical market confidently and capitalize on its dynamic opportunities.
Frequently Asked Questions (FAQ)
Q1: Why is Brent crude the global benchmark over WTI?
Brent’s lighter, sweeter quality, coupled with its central role in pricing oil from Europe, Africa, and the Middle East, make it the dominant global benchmark. WTI mainly reflects North American markets.
Q2: How does the U.S. dollar impact Brent prices?
Since oil is priced in U.S. dollars, a stronger dollar raises costs in other currencies, reducing demand and prices. A weaker dollar tends to boost oil prices.
Q3: What do ‘backwardation’ and ‘contango’ mean in futures?
Backwardation occurs when near-term futures trade above longer-dated contracts, signaling tight supply. Contango is the opposite—longer maturities trade at higher prices, indicating oversupply.
Q4: Can individual investors trade Brent futures directly?
Yes, but direct futures trading requires significant capital and comes with high risk. Many individuals prefer ETFs or ETNs linked to Brent futures for easier, lower-risk exposure.
Q5: Where can I find reliable real-time Brent futures data?
Trusted sources include the Intercontinental Exchange (ICE), financial platforms like Investing.com and TradingView, broker charting tools, and news outlets such as Bloomberg and CNBC.
